EOS Technical Analysis: EOS primed for a splendid move to $3
- EOS holds above long term support as bulls fight for a breakout to $3.
- EOS/USD must bring down the resistance at the 50-day SMA to shift the focus to $3.

EOS established and embraced the support of around $2.3. The same buyer congestion zone played a very vital role in the digital asset in May and June. It is doubtful that EOS will break this support to continue with the freefall to $2. Instead, technical indexes and other chart patterns hint at a possible breakout above $3.
EOS fights for breakout
The cryptoasset is currently ranked 13th in the cryptocurrency market, with a share of $2.3 billion. Over the last 24 hours, EOS attracted a trading volume of $1.6 billion. At the time of writing, EOS/USD is teetering at $2.5 while battling resistances at the descending triangle pattern and the 50-day Simple Moving Average (SMA).
If EOS stepped above the 50 SMA, buy orders are likely to surge, as investors anticipate a breakout in the direction of $3. The 200 SMA might delay the breakout by absorbing some of the buying pressure. However, gains above the 100 SMA could extend beyond $3, a move that will shift the buyers’ attention to higher levels.
-637405814417456742.png)
EOS/USD daily chart
The TD Sequential indicator recently presented a buy signal on the daily chart in a red nine candlestick. The bullish formation suggests that EOS’s least resistance path is upward, hence the possibility of a spike in one to four daily candlesticks. If buy orders shoot up, EOS might begin an uptrend, making $3 a conservative prediction.
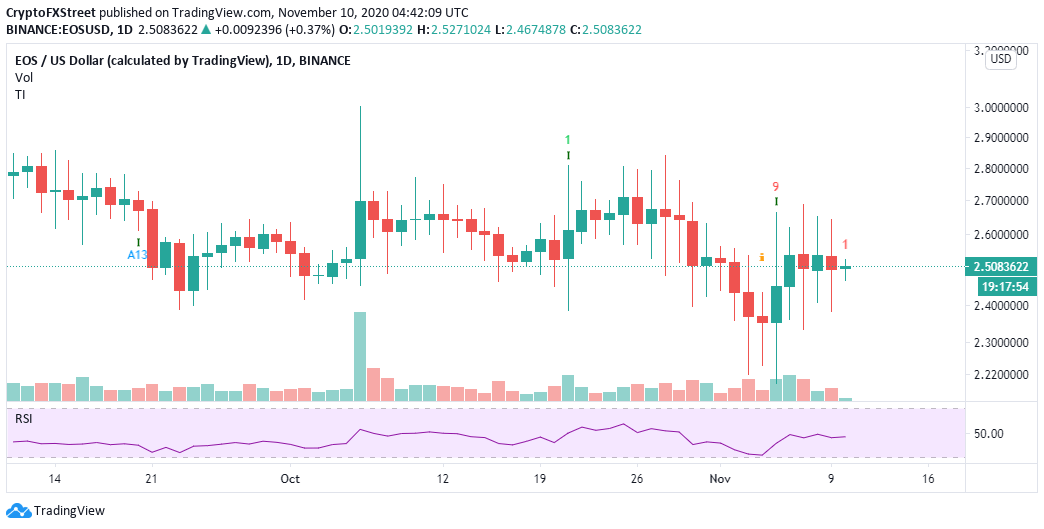
EOS/USD daily chart
It is worth mentioning that the descending triangle pattern formed on the daily chart is a bearish indicator. The upper trendline connects a series of lower highs while the horizontal line connects the lows. This triangle pattern often results in breakdowns due to the increase in short positions as traders push to lower the price.
Note that it is essential for traders to wait for a confirmed price action before going all-in. In this case, trading under the support at $2.3 may increase sell orders that could force EOS to $2.
Author

John Isige
FXStreet
John Isige is a seasoned cryptocurrency journalist and markets analyst committed to delivering high-quality, actionable insights tailored to traders, investors, and crypto enthusiasts. He enjoys deep dives into emerging Web3 tren



