Elrond price in an optimal pattern as new MPAD token announced
- Elrond price illustrating a pennant pattern at long-term Fibonacci extension.
- Maiar Launchpad (MPAD) is where teams, technologies, and products are designed.
- Daily Relative Strength Index (RSI) not showing an overbought condition.

Elrond price eclipsed the February high, the 161.8% Fibonacci extension of the 2019-2020 bear market, and tagged the ascending triangle measured move target in the last couple of weeks. The current pattern illustration on the intra-day charts appears to be a pennant, projecting a renewal of the rally triggered on April 2.
MPAD token will bring cutting-edge projects to Elrond
The Maiar Launchpad’s debut is the newest development for EGLD in its pursuit of being the fastest, most scalable, and secure blockchain platform in the internet economy. In the words of Elrond, the platform “will be the ultimate catalyst for new technologies and unique products built with Elrond tech.”
New projects on the Launchpad will have access to decentralized funding from the platform. They will be announced to the entire community, partners, and investors, as well as the broader Elrond ecosystem. The wealth of support and feedback will help them achieve their ultimate goals

Source: Elrond Blog
To promote fairness and widespread access to contemporary technologies and startups emerging on Elrond, the Maiar Launchpad will be sustained by the MPAD token. It will be the second ecosystem token that should attract the most impressive blockchain projects to the ecosystem.
Details on the MPAD token will be announced in the next two weeks.
Elrond price action affirms it is an ascending decentralized platform
In April, speculators have agreed that EGLD has combined the best features of leading cryptocurrencies in the decentralized platform space and even improved upon them. After coming to a high near the measured move target of $245.55, the altcoin has slipped into a pennant pattern as it consolidates gains and generates the energy to shake free from the 161.8% extension of the 2019-2020 bear market.
If EGLD does complete a pennant pattern, the technical framework anticipates the rally to extend to at least the 138.2% extension of the February correction at $343.41, yielding a 44% move from the pattern breakout.
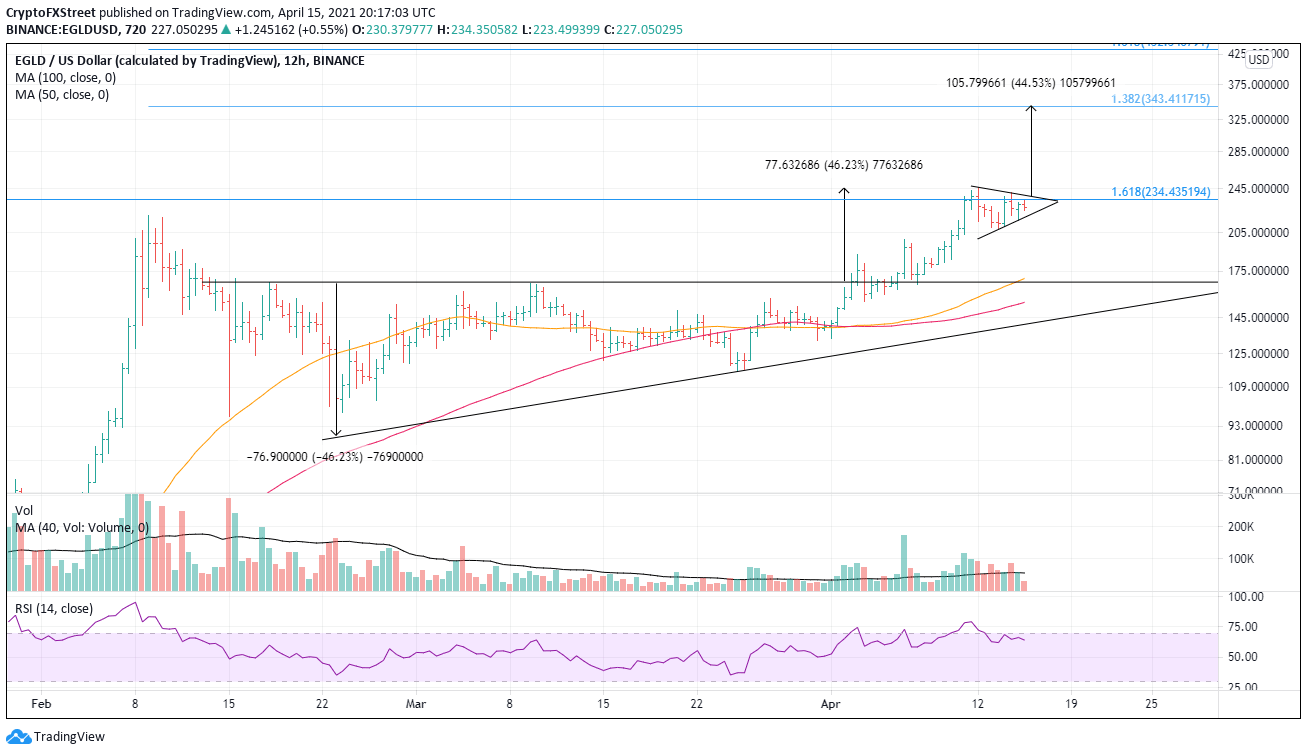
EGLD/USD 12-hour chart
Downside support begins at the April 13 low at $208.04, followed by the April 6 high at $199.49. Anything below that level would lead to a necessary recalculation of the positive EGLD outlook.
Author

Sheldon McIntyre, CMT
Independent Analyst
Sheldon has 24 years of investment experience holding various positions in companies based in the United States and Chile. His core competencies include BRIC and G-10 equity markets, swing and position trading and technical analysis.



