Dusk price looks poised for correction as on-chain metrics turn bearish
- Dusk price faces resistance at the daily bearish order block area extending from $0.503 to $0.515.
- On-chain data shows DUSK’s rising Social Dominance and falling Development Activity.
- A daily candlestick close above $0.515 would invalidate the bearish thesis.

Dusk (DUSK) encountered resistance at the daily bearish order block area, extending from $0.503 to $0.515 on Monday, potentially indicating a price correction. On-chain analysis hints at the formation of the local peak for DUSK as Development Activity declines while Social Dominance rises, suggesting a period of consolidation or potential reversal.
Dusk price likely to correct
Dusk price currently faces resistance at the April 8 bearish order block area extending from $0.503 to $0.515. A bearish order block is an area where market participants, such as institutional traders, have placed huge sell orders.
If this resistance holds, Dusk could reject further to find support at $0.425, the 61.8% Fibonacci retracement level drawn from the swing low of $0.280 on May 15 to the swing high of $0.515 on June 10.
If the overall crypto market outlook fails to improve, DUSK could extend the crash to its next support level at $0.370, the 38.20% Fibonacci retracement level, constituting an additional 13% loss
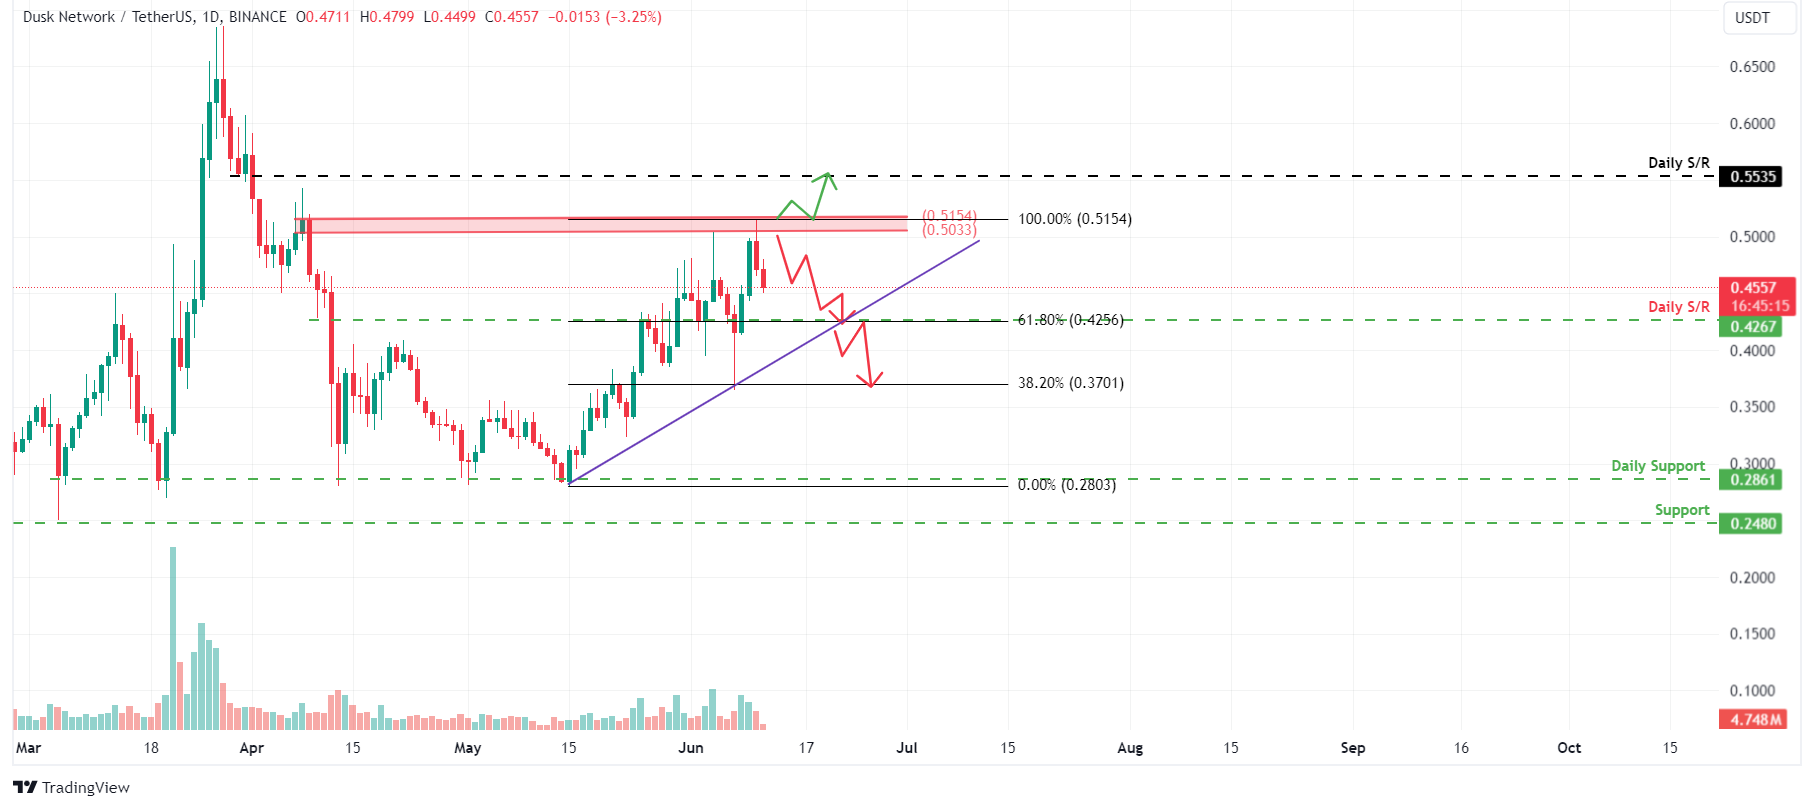
DUSK/USDT 1-day chart
Santiment’s Development Activity metric tracks the frequency of project development events recorded in the public GitHub repository over time.
A rise in this metric usually suggests continuous endeavors to uphold, innovate, and improve the protocol, which is generally seen as favorable by investors and stakeholders. Conversely, a decline in the metric might raise apprehensions about the project's endurance, capacity for innovation, and engagement with the community in the foreseeable future.
As in DUSK’s case, the index is falling from 49.98 on May 20 to 38.19 on June 11. The 24% fall in Dusk's Developing Activity signals concerns regarding the project's sustainability, innovation capacity, and community involvement over the long term, which adds further credence to the bearish outlook.
%20[12.43.20,%2011%20Jun,%202024]-638536986349856231.png)
DUSK Development Activity chart
Santiment’s Social Dominance metric shows the coin's share or % of mentions on crypto social media compared to top projects. A spike in this metric during rallies often signals local tops, particularly with mid and low-capitalization coins. Increased chatter during breakouts is typically pump-related, indicating a risky period for position entry or retention.
As in DUSK’s case, a spike has been seen on Tuesday, signaling the formation of a local top in DUSK price, adding credence to the bearish outlook.
%20[12.41.39,%2011%20Jun,%202024]-638536986873926443.png)
DUSK Social Dominance chart
Despite strong technical analysis and on-chain data, if DUSK’s daily candlestick closes above $0.515 and establishes a higher high on the daily timeframe, it may signal a shift in market dynamics that favors bullish sentiment. Such a change could nullify the bearish outlook, leading to a 7% rally in the Dusk price to the previous resistance level of $0.553.
Author

Manish Chhetri
FXStreet
Manish Chhetri is a crypto specialist with over four years of experience in the cryptocurrency industry.


