Dusk price sets the stage for a 20% rally
- Dusk price is currently being rejected at around $0.426 level.
- The on-chain metric suggests DUSK growing network and dormant wallets are moving upwards again.
- A daily candlestick closing below $0.286 would invalidate the bullish thesis.

Dusk (DUSK) price is currently being rejected at a key resistance level, which could lead to a short-term correction. But on-chain data show a spike in network growth and movement in inactive wallets, both of which, indicate that the bulls are preparing for their next move.
Dusk price provides an opportunity to accumulate
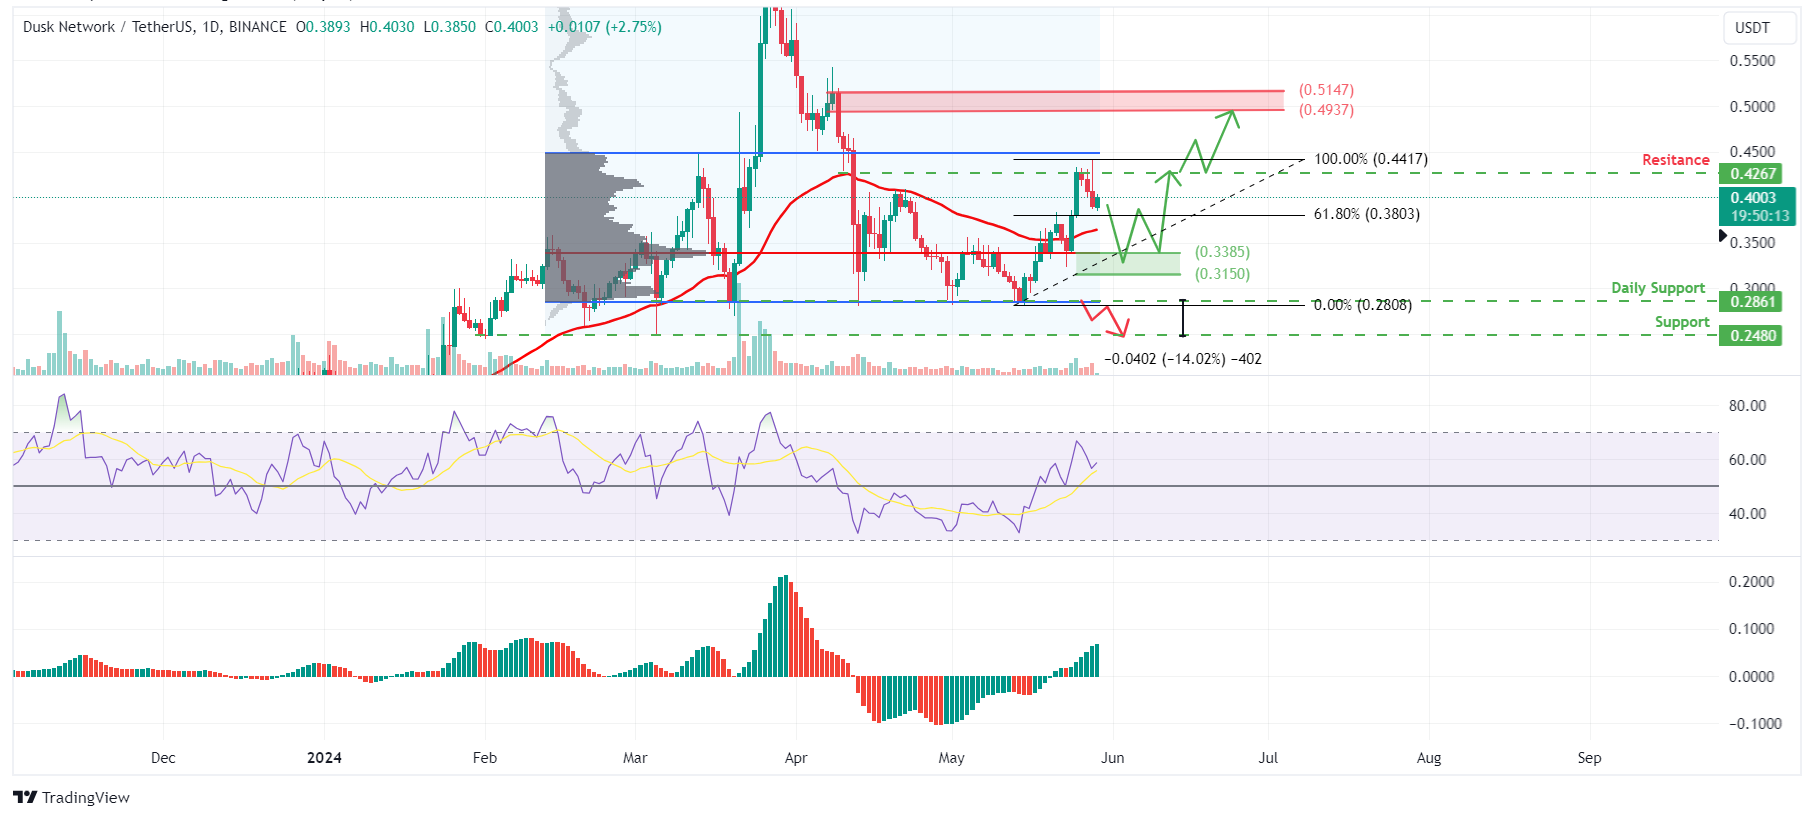
Dusk price broke above the 50-day Exponential Moving Average (EMA) at $0.355 on Friday as it rallied 23%, and is now facing resistance around $0.426. Due to this impulsive move, DUSK bulls could take a break, leading to a retracement, which could be a good buying opportunity for sidelined investors.
The potential pullback could find support at these levels.
- The 61.80% Fibonacci retracement level at $0.380.
- The 50-day EMA hovering at $0.364.
- The $0.338 to $0.315 range is indicated by the volume profile.
Assuming Dusk price bounces off the $0.380 level, it could rally 20% to its previous high of $0.442. Supporting the aforementioned bounce are the Relative Strength Index (RSI) and Awesome Oscillator (AO) indicators, which are firmly present above their respective mean values of 50 and 0. The momentum indicators are clearly signaling that the bullish momentum is in control. In case of an aggressive bullish outlook, DUSK could extend the rally by 33% to retest the April 8 bearish order block, extending from $0.493 to $0.514.
DUSK/USDT 1-day chart
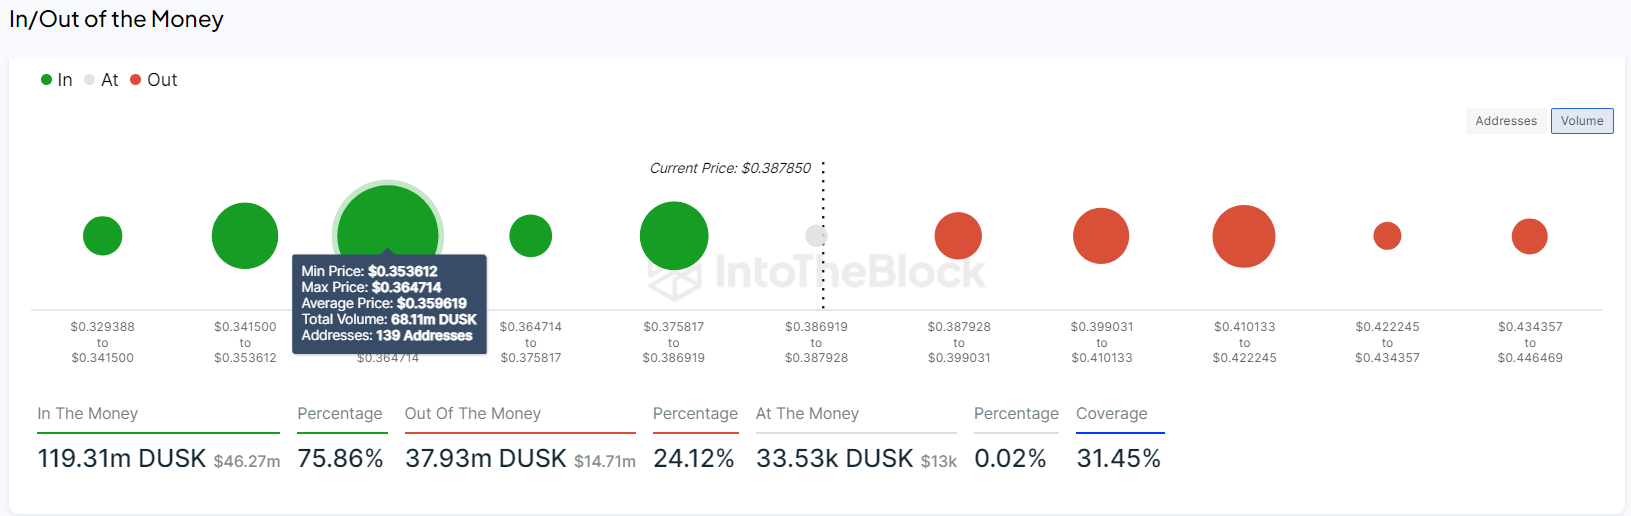
According to IntoTheBlock's In/Out of the Money Map (IOMAP), around 139 addresses have acquired 68.11 million DUSK tokens. These addresses bought DUSK tokens between $0.353 and $0.364, indicating a critical support zone, coinciding closely with the levels mentioned above. Hence, this area serves a good level to accumulate as these investors will likely increase their holdings if Dusk revisits their entry level.
Dusk IOMAP chart
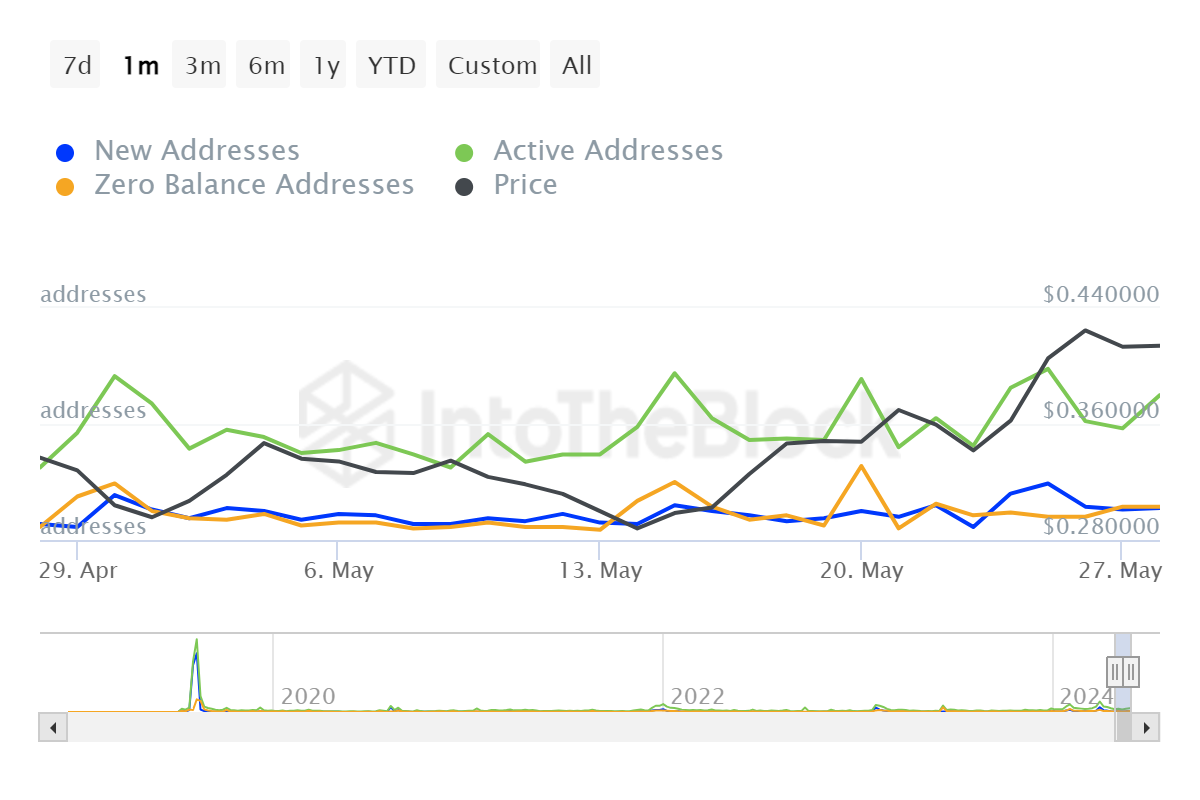
On-chain data from IntoTheBlock adds a bullish view for DUSK. The number of active addresses increased dramatically from 50 on April 28 to 100 on May 28, implying a growing demand for the Dusk network, which adds further credence to the bullish outlook proposed above.
Dusk Daily Address chart
Santiment's Age Consumed index aligns with the bullish outlook from a technical perspective. The spikes in this index suggest dormant tokens (tokens stored in wallets for a long time) are in motion and can be used to spot short-term local tops or bottoms.
For DUSK, history shows that the spikes were followed by a rally in Dusk price. The most recent uptick on April 17 also forecasts a potential bullish move for DUSK.
%20[07.55.37,%2029%20May,%202024]-638525606289752305.png)
Dusk Age Consumed chart
Despite strong technical analysis and on-chain data, if the Dusk price produces a daily candlestick close below $0.286, it would invalidate the bullish thesis by producing a lower low on a higher timeframe. This development could see Dusk price fall 14% to the key support level of $0.248.
Author

Manish Chhetri
FXStreet
Manish Chhetri is a crypto specialist with over four years of experience in the cryptocurrency industry.



