Dogecoin Price Prediction: DOGE poised for 64% breakout if this key level breaks
- Dogecoin price looks ready for a 64% climb as it moves higher toward the upper boundary of the symmetrical triangle pattern.
- A break above $0.269 could put the bullish target of $0.435 on the radar.
- DOGE may discover a strong foothold at $0.242 if selling pressure spikes.

Dogecoin price is preparing for a 64% rally, but the dog-themed token has one last hurdle to overcome before the bullish target is in the offing. DOGE must climb above the descending resistance trend line that has acted as a headwind for the token since June 3.
Dogecoin price to clear one last barrier
Dogecoin price has formed a symmetrical triangle pattern on the daily chart as the bulls catch their breath. While DOGE consolidates, the token is supported by a few significant technical indicators, suggesting that the token is poised to aim higher.
The prevailing chart pattern suggests a 64% climb for Dogecoin price if the token manages to slice above the upper boundary of the technical pattern at $0.269. Before the bulls can anticipate a bull run toward the optimistic target, DOGE would also need to conquer the nearest resistance at 50% Fibonacci retracement level at $0.255.
If a spike in buying pressure occurs, and Dogecoin breaks above $0.27, DOGE would be met with another obstacle at the 61.8% Fibonacci retracement level, coinciding with the 200-day Simple Moving Average (SMA) at $0.277.
Additional hurdles may emerge at the 78.6% Fibonacci retracement level at $0.310, then at the August 16 high at $0.351 before eventually reaching the aforementioned bullish target at $0.435.
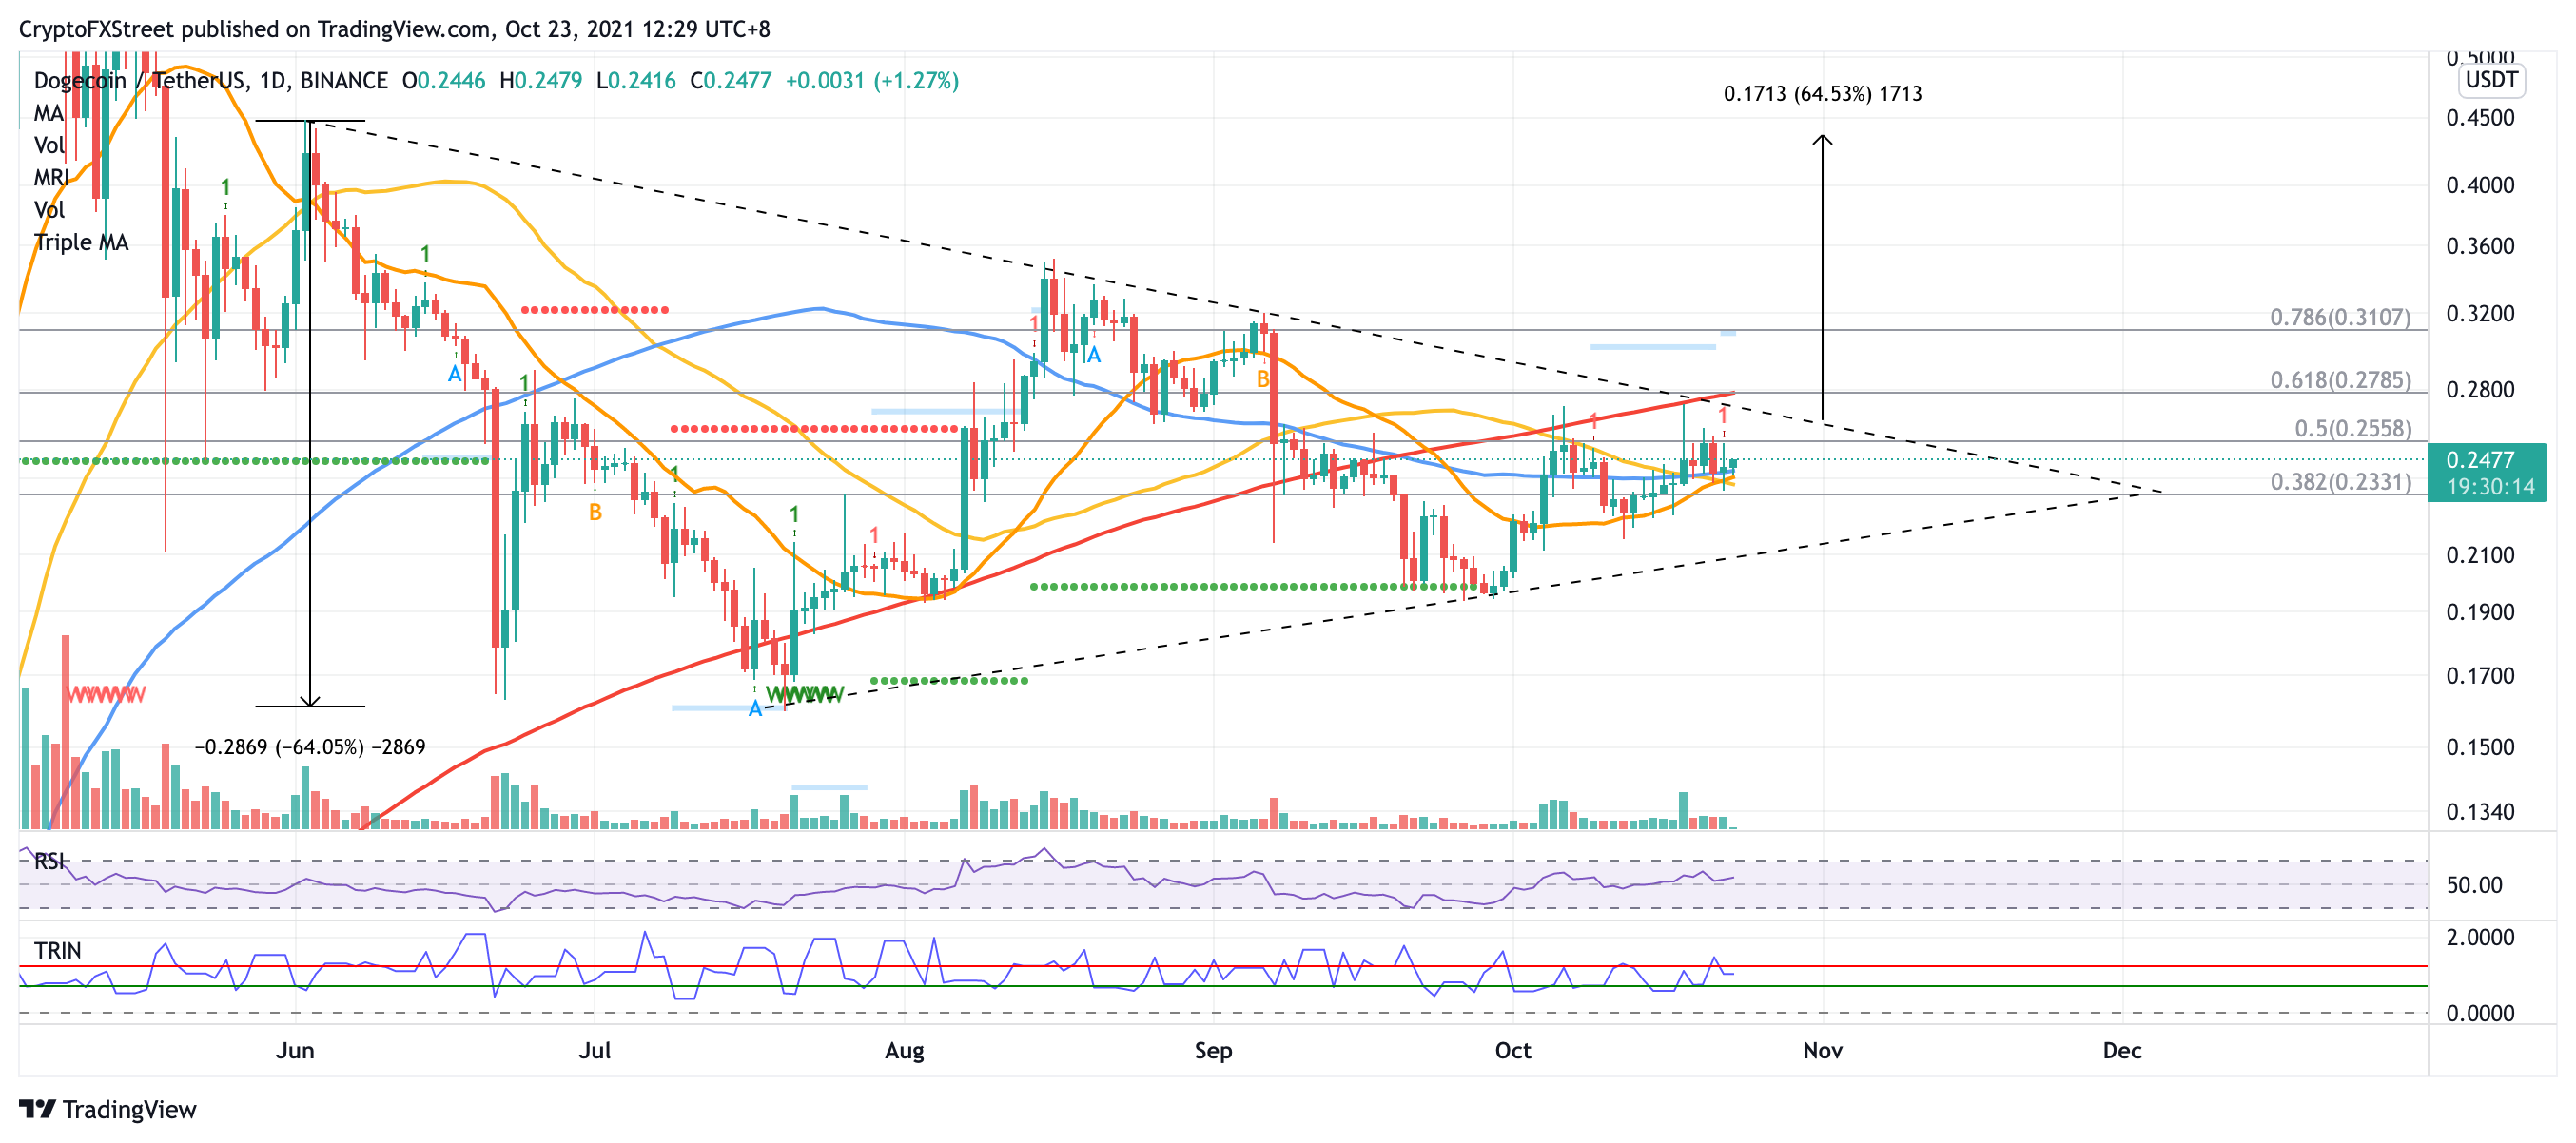
DOGE/USDT daily chart
Given that Dogecoin price is still trapped in a consolidation pattern, DOGE could still oscillate within the governing technical pattern until a decisive move toward the upside, accompanied by a surge in buy orders. Until then, the dog-themed token may be exposed to minor sell-offs, in which case the nearest foothold at the 100-day SMA at $0.242 will act as substantial support.
Adding credence to the strength of this support level is IntotheBlock’s In/Out of Money Around Price (IOMAP), indicating that 80,240 addresses purchased 14.73 billion DOGE at an average price of $0.242.
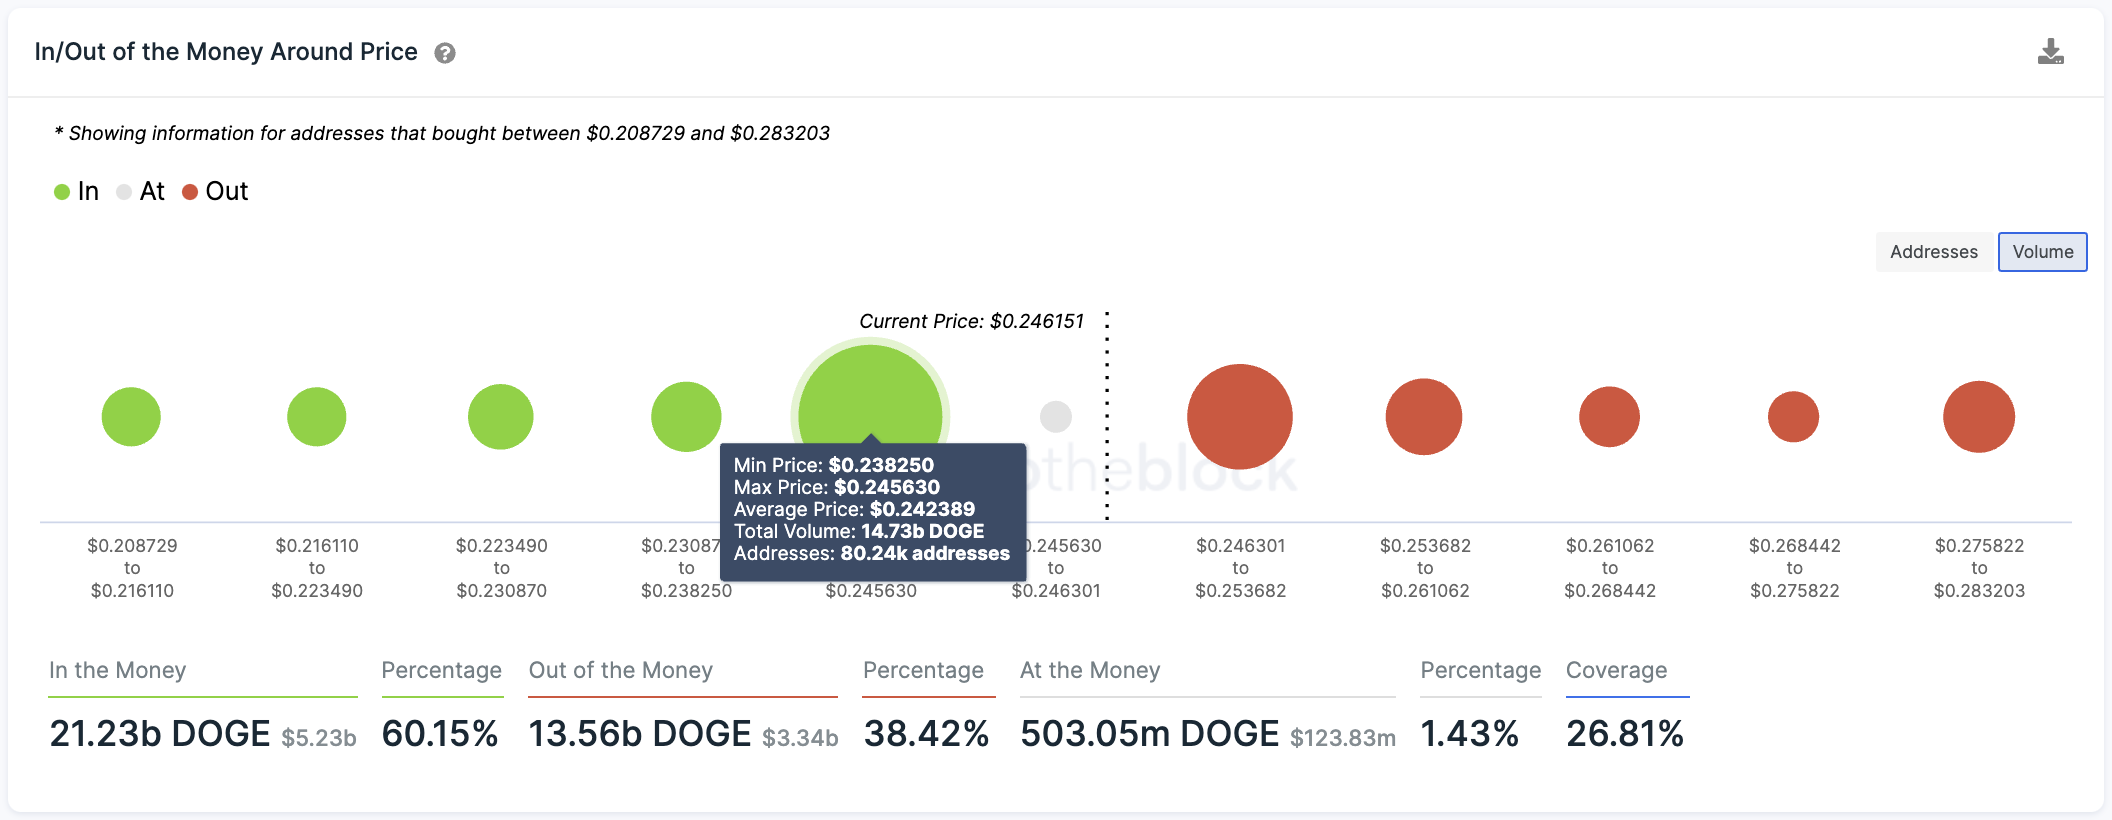
DOGE IOMAP
Additional lines of defense will appear at the 20-day and 50-day SMAs, which sit at $0.238 before dropping lower toward the 38.2% Fibonacci retracement level at $0.233. Only a rise in selling pressure would see Dogecoin price tag the lower boundary of the triangle at $0.213.
Author

Sarah Tran
Independent Analyst
Sarah has closely followed the growth of blockchain technology and its adoption since 2016.



