Three critical reasons why Dogecoin price will easily quadruple
- Dogecoin price is creating a massive fractal that hints at a 361% breakout move incoming soon.
- DOGE has already breached a crucial resistance level, suggesting the start of a bull rally.
- A breakdown of the $0.16 support floor will put the altcoin in jeopardy and on a path to invalidating the bullish thesis.

Dogecoin price might seem in a lull, as DOGE-killers like Shiba Inu and other meme coins are hogging the spotlight – nor has the dog-themed cryptocurrency's own lacklustre performance helped its cause, but things are set to change as a multi-month consolidation now promises a stunning breakout.
Dogecoin price screams bullish every way you look at it
Dogecoin price shows three possible outcomes, all of which are bullish. The first sees DOGE slicing through the support area ranging from $0.213 to $0.230. This move, albeit bearish in the short-term, would lead to a retest of $0.195, where Dogecoin price can form a double bottom and kick-start a new uptrend to $0.30 or $0.352.
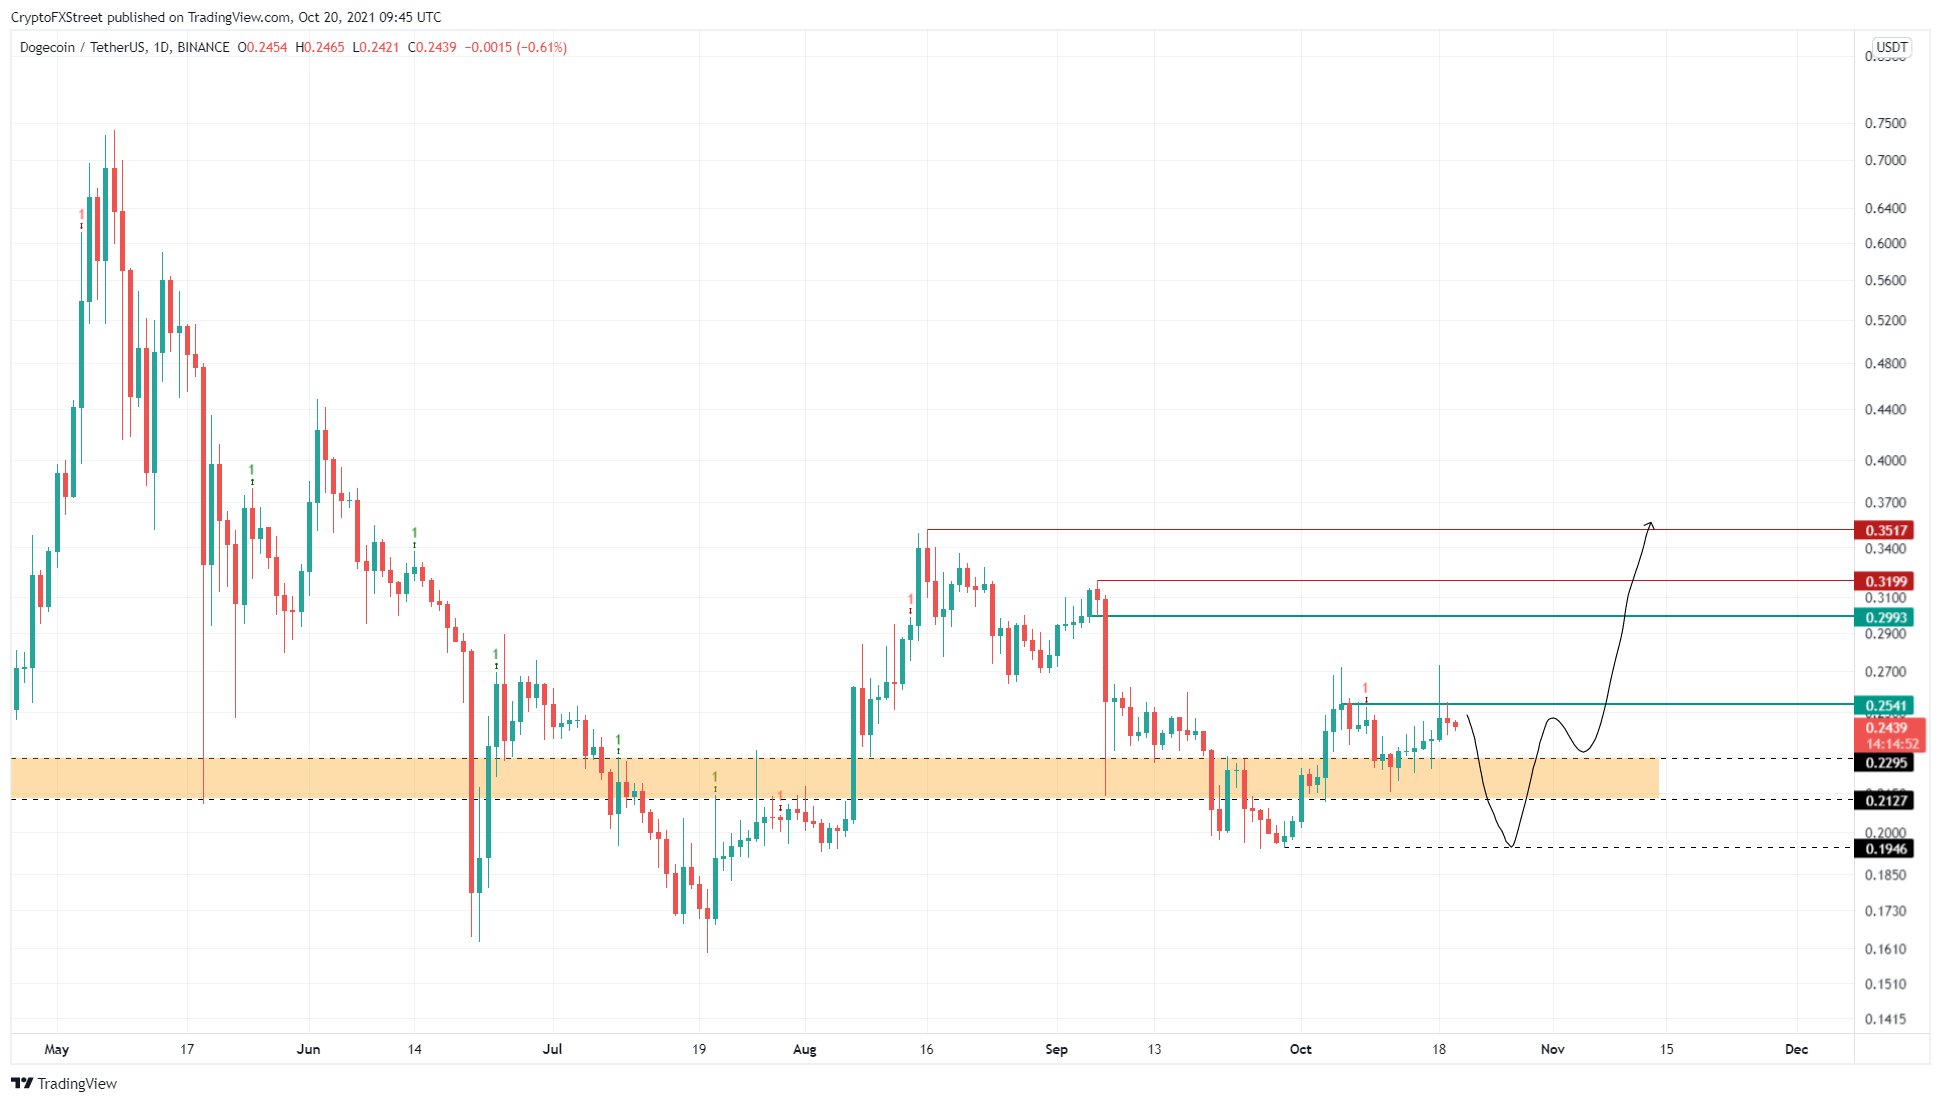
DOGE/USDT 1-day chart
The second outcome is for Dogecoin price to shatter the $0.195 support floor. This move would lead to a 35% drop from the current position, knocking the meme-themed cryptocurrency down to a stable support floor at $0.160.
While this might appear bearish, it would create a triple-top setup, aka bottom reversal pattern. This pattern would allow retail investors to purchase DOGE at a discount, pushing DOGE to retest the intermediate resistance levels at $0.424 or near the all-time high levels around $0.680. Either way, bottom reversal patterns are often seen in the cryptocurrency space and are one of the reasons why Bitcoin price kick-started its massive recovery rally after crashing to $28,000.
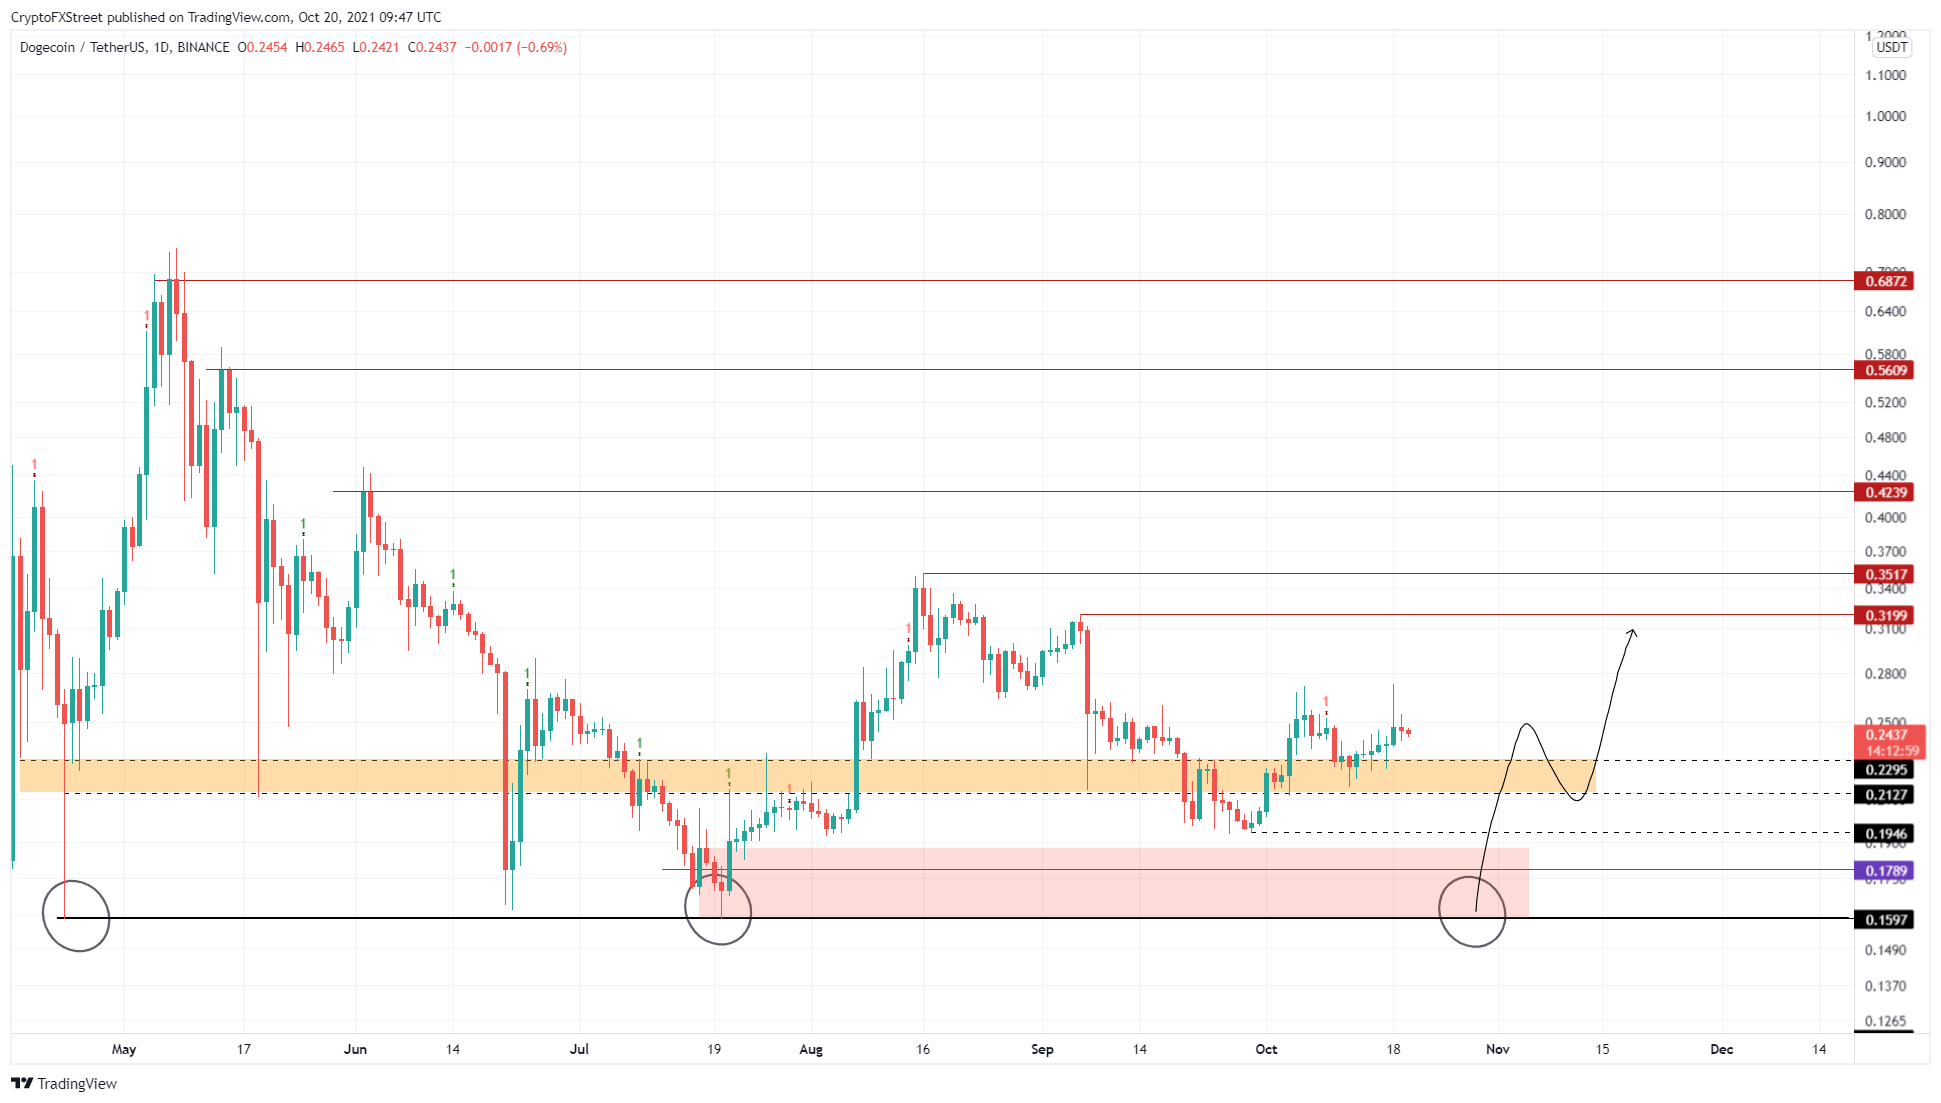
DOGE/USDT 1-day chart
DOGE fractal forecasts an eye-popping rally
The third outcome is for Dogecoin price to form a fractal – a formation that often develops after an extended run-up.
From early July 2020 to early January 2021, DOGE formed a rounding bottom pattern, which led to a breakout and a 1,435% ascent.
This run-up pushed the Dogecoin price from $0.0057 to $0.088. After reaching a new all-time high in early 2021, the dog-themed cryptocurrency slid into consolidation for more than two months, creating a descending triangle.
A breakout from this setup triggered another exponential leg-up that propelled the Dogecoin price by 1,102% to a new all-time high at $0.740. Since this new high, the meme coin has been coiling up, creating four lower highs and three equal lows.
Connecting these swing points using trend lines shows the formation of a descending triangle. This pattern forecasts a 363% ascent to $1.086, obtained by adding the distance between the first swing high and the horizontal support to the breakout point.
While the Dogecoin price has broken out of this setup, investors need to wait for a higher high above $0.36 to confirm the start of a new uptrend.
Either way, this technical formation is hinting at the start of a new leg-up that will quadruple the market value of DOGE soon.
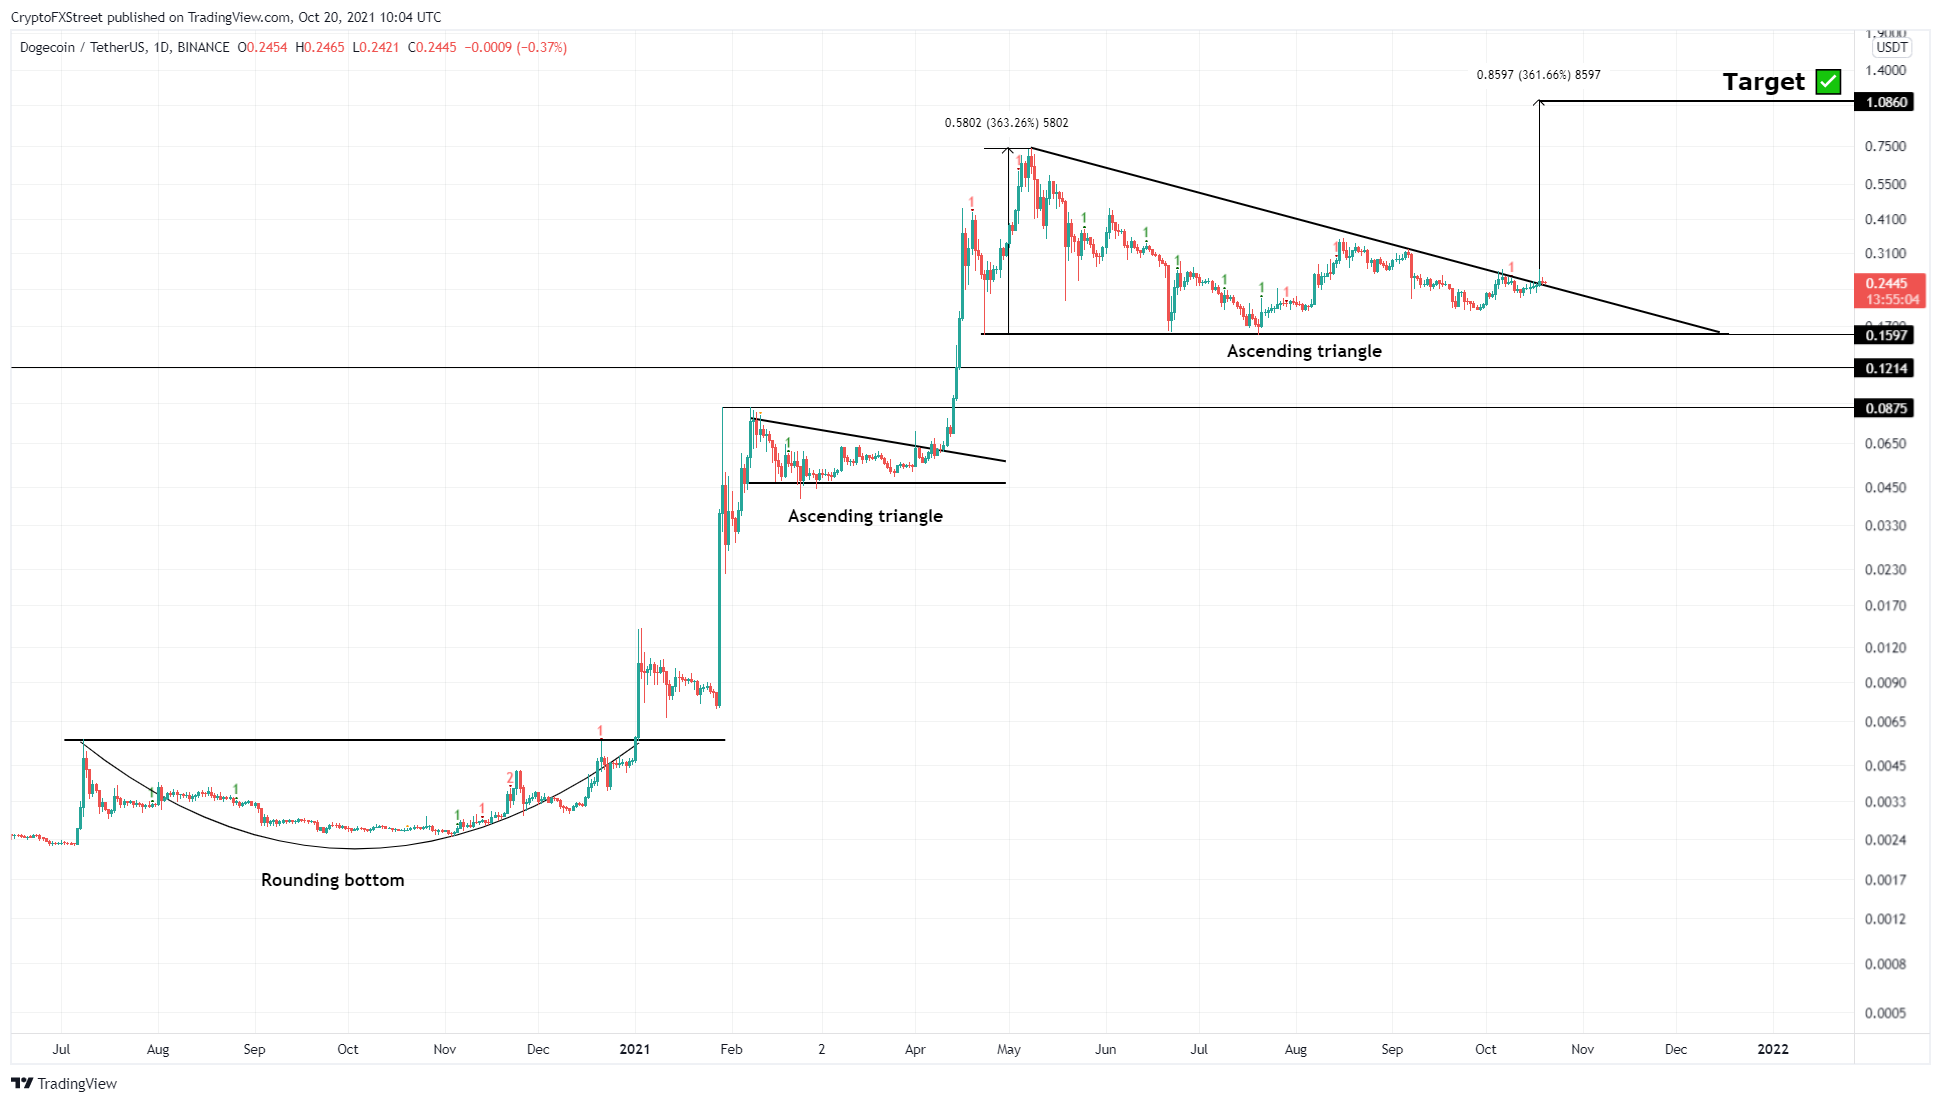
DOGE/USDT 1-day chart
While things are looking good for Dogecoin price in three possible outcomes, a breakdown of the $0.16 barrier could prove fatal for the altcoin. This move will knock DOGE down to $0.121, a breakdown of which will invalidate the bullish thesis and catalyze a 30% crash to the $0.09 support level.
Author

Akash Girimath
FXStreet
Akash Girimath is a Mechanical Engineer interested in the chaos of the financial markets. Trying to make sense of this convoluted yet fascinating space, he switched his engineering job to become a crypto reporter and analyst.



