- Dogecoin has formed a classic cup-and-handle bullish pattern, ready for another upswing.
- Support at the 50 SMA on the 4-hour chart must be guarded to secure the uptrend.
- The IOMAP shines a light on the challenging resistance ahead of DOGE, which may delay the uptrend.
Dogecoin is holding above key support following correction from the all-time high at $0.088. The ‘Meme Coin’ is trading at $0.058, as bulls fight to resume control. Peter Brandt, a renowned trader, has suggested in his latest analysis that the DOGE is primed for a massive 70% upswing to $0.143.
Classic Cup & Handle pattern. $DOGE pic.twitter.com/vnE317M2E0
— Peter Brandt (@PeterLBrandt) February 15, 2021
Dogecoin technical levels flipping bullish
DOGE has formed a classic cup-and-handle pattern on the 4-hour chart. The technical pattern is regarded as a bullish signal whereby the right-hand side goes through a period of low trading volume. The cup-and-handle pattern can form both in short and long timeframes.
When properly timed, this pattern offers excellent entry positions. It is confirmed as the handle reaches maturity, which is marked by low trading volume. A breakout comes into the picture when the volume starts to increase, leading to a retest of the previous high.
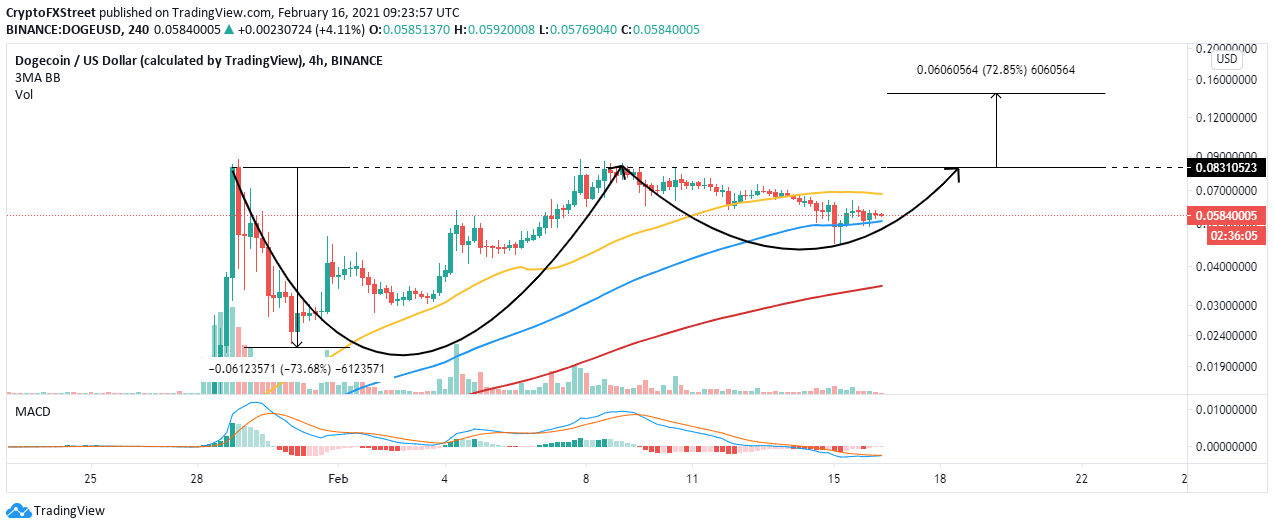
DOGE/USD 4-hour chart
The same 4-hour chart shows Dogecoin trading above the 100 Simple Moving Average (SMA). If this support remains intact, bulls will have the opportunity to focus on breaking the near-term 50 SMA resistance. Trading above this critical level could jumpstart the rally to highs above $0.1 and set Dogecoin on the path towards $0.143.
Looking at the other side of the fence
The IOMAP model developed by IntoTheBlock, a leading on-chain analysis platform, highlights rising selling pressure, especially in the region between $0.058 and $0.06. Here, nearly 36,000 addresses had bought roughly 5.6 billion DOGE. Slicing through this level might be an uphill task.
Dogecoin IOMAP chart
On the downside, robust support exists to ensure that losses are stopped. For instance, the most significant buyer congestion zone lies between $0.053 and $0.055. Here, nearly 1,700 addresses had previously bought 3.4 billion DOGE. The model generally shows that consolidation will take precedence before the breakout mentioned above comes into the picture.
Information on these pages contains forward-looking statements that involve risks and uncertainties. Markets and instruments profiled on this page are for informational purposes only and should not in any way come across as a recommendation to buy or sell in these assets. You should do your own thorough research before making any investment decisions. FXStreet does not in any way guarantee that this information is free from mistakes, errors, or material misstatements. It also does not guarantee that this information is of a timely nature. Investing in Open Markets involves a great deal of risk, including the loss of all or a portion of your investment, as well as emotional distress. All risks, losses and costs associated with investing, including total loss of principal, are your responsibility. The views and opinions expressed in this article are those of the authors and do not necessarily reflect the official policy or position of FXStreet nor its advertisers. The author will not be held responsible for information that is found at the end of links posted on this page.
If not otherwise explicitly mentioned in the body of the article, at the time of writing, the author has no position in any stock mentioned in this article and no business relationship with any company mentioned. The author has not received compensation for writing this article, other than from FXStreet.
FXStreet and the author do not provide personalized recommendations. The author makes no representations as to the accuracy, completeness, or suitability of this information. FXStreet and the author will not be liable for any errors, omissions or any losses, injuries or damages arising from this information and its display or use. Errors and omissions excepted.
The author and FXStreet are not registered investment advisors and nothing in this article is intended to be investment advice.
Recommended Content
Editors’ Picks
Ripple's move above this key level could trigger nearly 50% rally for XRP
Ripple has overcome a critical resistance level and flipped into a support floor on the weekly time frame. This development happened while XRP tightly consolidated for roughly 250 days. Investors can expect XRP to kickstart a massive rally.
Optimism price outlook with nearly $90 million worth of OP tokens flooding markets on Friday
Optimism volatility has shrunk in the ours leading to the network’s cliff unlock. It joins the likes of dYdX and Sui, which have similar events on their calendars. As token unlocks are often considered bearish catalysts, investors should brace for a reaction after the event.
Top 3 Price Prediction Bitcoin, Ethereum, Ripple: Retail watches from the sidelines with a bias for shorts
Bitcoin could clear $73,777 peak as BTC bulls resurface. Ethereum might fall 10% before next leg up as ETH RSI teases with sell signal. XRP could lose $0.6000 threshold as Ripple bulls fail to show up.
Jito price could hit $6 as JTO coils up inside this bullish pattern
Jito price action shows a potential cup and handle formation. Based on theoretical measurement rules, a successful breakout could yield a 56% rally to $6.0. A breakdown of the $3.86 support level would create a lower low for JTO and invalidate the bullish thesis.
Bitcoin: BTC may have recovered, but is it out of the woods?
Bitcoin’s (BTC) upward momentum has shown a significant decline for the past two weeks or so. This development led to a bearish signal on the weekly and an uncertain outlook on the monthly.