Dogecoin Price Forecast: DOGE is on the brink of correction to $0.06
- Dogecoin is holding at the 50 SMA, but if this support is shattered, losses may extend to $0.06.
- The short-term technical picture adds credence to the bearish outlook.
- Recovery above the ascending channel’s middle boundary could sustain the uptrend to $0.1.

Dogecoin has managed to hold onto most of the gains accrued throughout the week. However, it is essential to mention that a correction occurred from the new record high of $0.089 to price levels slightly above $0.06. At the time of writing, DOGE is dancing at $0.068 amid the push by buyers to avert potential losses.
Dogecoin breakdown looms if two crucial levels are broken
The 50 Simple Moving Average on the 4-hour chart is the immediate support. Trading below this area will put the ascending parallel channel’s support in jeopardy. Note that massive sell orders will come into the picture if Dogecoin starts exploring levels beneath the channel.
According to the Moving Average Convergence Divergence (MACD), the least resistance path is downwards. This follows a recent MACD line (blue) cross below the signal line. Besides, the bearish outlook will become apparent in the event the MACD slides into the negative region.
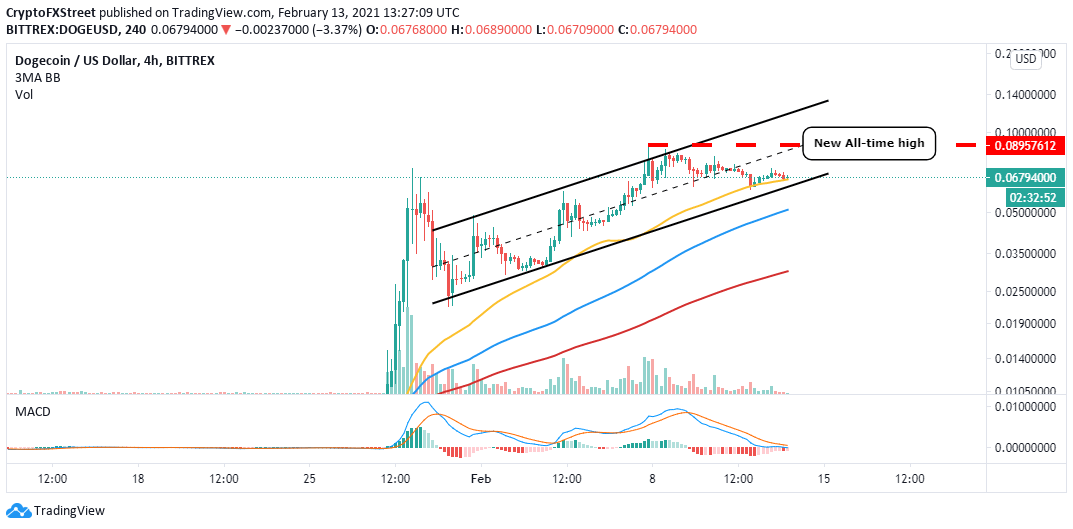
DOGE/USD 4-hour chart
The IOMAP model by IntoTheBlock brings to light the numerous seller congestion zones ahead of Dogecoin. The region between $0.073 and $0.074 is the most robust resistance zone. It hosts nearly 59,000 addresses that had previously bought roughly 5.4 billion DOGE. It will be an uphill task to rise above this area; hence, the pessimistic outlook is strengthened.
On the flip side, medium-strong support has been established between $0.066 and $0.068. If the bearish technical outlook remains intact, Dogecoin could slice through this area and force the bulls to seek refuge at a lower zone. This robust support runs from $0.058 to $0.06. Here, roughly 37,000 addresses had previously bought around $5.4 billion DOGE.
-637488200187199782.png)
Dogecoin IOMAP chart
Looking at the other side of the picture
Dogecoin will resume the uptrend if the immediate support at the 50 SMA remains intact. If push comes to shove, the lower edge of the channel can stop the losses. However, action beyond the middle boundary will call for more buyer orders as investors rush to take a piece of the cake as they wait for gains above $0.1.
Author

John Isige
FXStreet
John Isige is a seasoned cryptocurrency journalist and markets analyst committed to delivering high-quality, actionable insights tailored to traders, investors, and crypto enthusiasts. He enjoys deep dives into emerging Web3 tren


