Dogecoin price is set for a downturn as it encounters its resistance barrier
- Dogecoin price is testing the resistance around the 100-day EMA at $0.1073, with an impending decline ahead.
- On-chain data shows DOGE's daily active addresses decreasing and dormant wallets moving again, signaling a bearish move.
- A weekly candlestick close above $0.1073 would invalidate the bearish thesis.
Dogecoin (DOGE) price rose slightly during Asian trading hours on Friday, approaching the critical resistance zone around $0.1073. On-chain data shows DOGE's daily active addresses decreasing and dormant wallets moving again, signaling a bearish outlook for Dogecoin in the upcoming days.
Dogecoin price poised for rejection after retesting key resistance level
Dogecoin's price finds resistance around its 100-day Exponential Moving Average (EMA), which is around $0.1073. This level also aligns with the weekly resistance level of $0.1018. As of Friday, it trades slightly higher by 1% at $0.1010.
If the 100-day EMA at $0.1073 holds as resistance, DOGE could decline 24% to retest its next weekly support at $0.0782.
The Relative Strength Index (RSI) and the Awesome Oscillator (AO) on the weekly chart trade below their neutral levels of 50 and zero, respectively, suggesting an impending bearish trend.
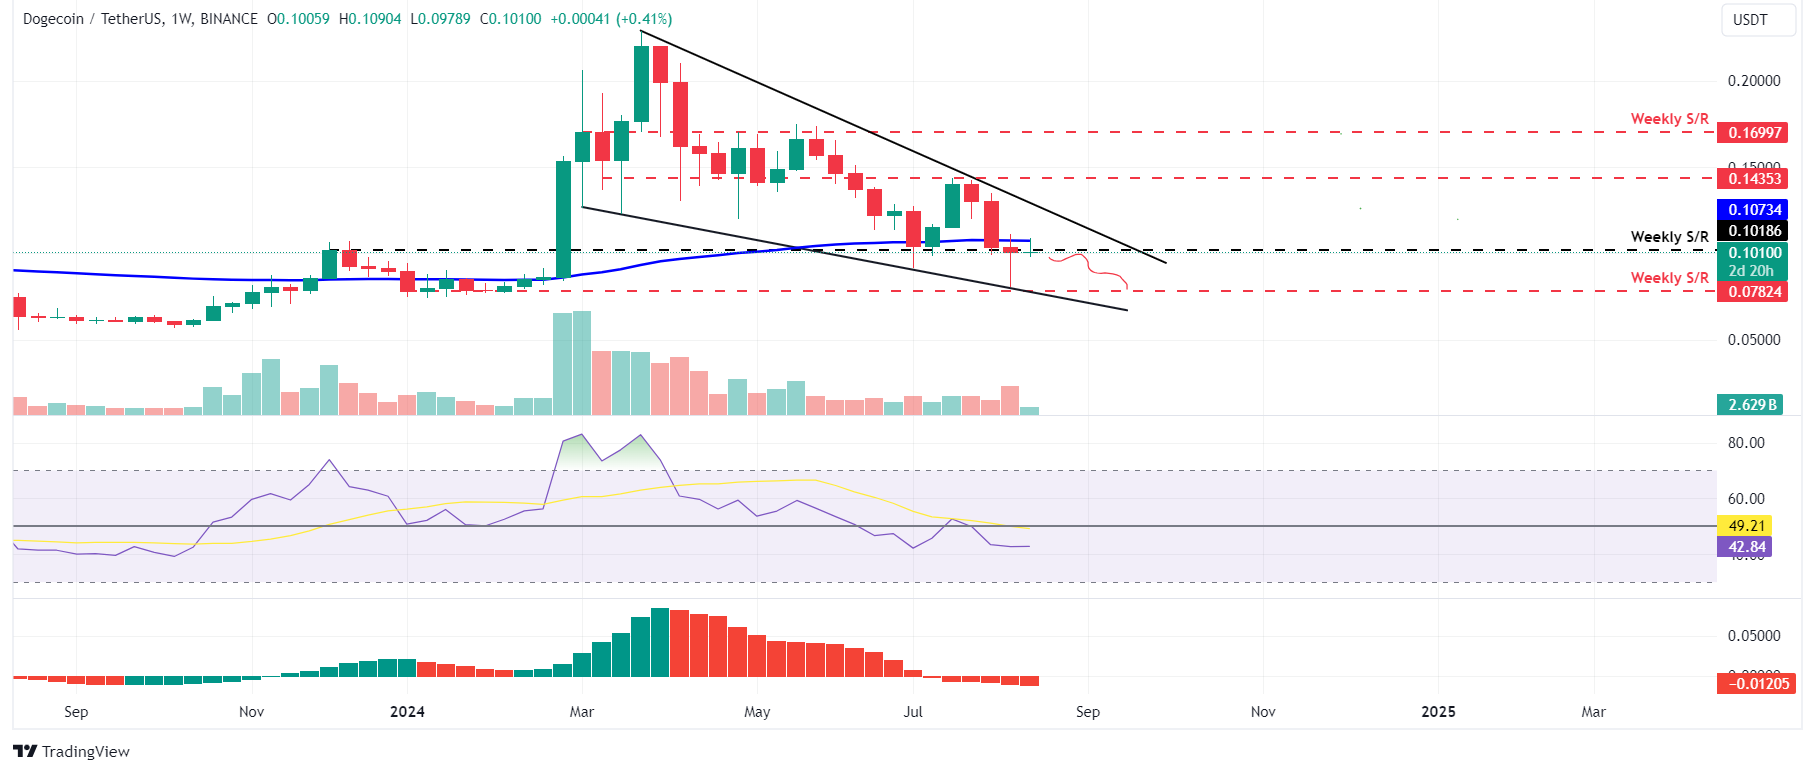
DOGE/USDT weekly chart
Santiment's Daily Active Addresses index, which helps track network activity over time, aligns with the bearish outlook noted from a technical perspective. A rise in the metric signals greater blockchain usage, while declining addresses point to lower demand for the network.
In Doge's case, Daily Active Addresses have declined 10% this week and have been falling constantly since mid-March, indicating demand for DOGE's blockchain usage is decreasing.
%20[10.05.13,%2016%20Aug,%202024]-638593846147081358.png)
DOGE Daily Active Addresses chart
Additionally, Santiment's Age Consumed index shows that spikes in this metric suggest dormant tokens (tokens stored in wallets for a long time) are in motion and can be used to spot short-term local tops or bottoms.
For DOGE, history shows that the spikes were followed by a decline in Dogecoin price. The most recent uptick on August 6 also forecasted that DOGE was ready for a downtrend.
%20[10.06.01,%2016%20Aug,%202024]-638593846533563937.png)
DOGE Age Consumed chart
Even though on-chain metrics and technical analysis point to a bearish outlook, if the Dogecoin price produces a weekly candlestick close above $0.1073, the move would invalidate the bearish thesis. This development could see DOGE's price rally to revisit its weekly resistance at $0.1435.
Author

Manish Chhetri
FXStreet
Manish Chhetri is a crypto specialist with over four years of experience in the cryptocurrency industry.


