Dogecoin faces key hurdles as it attempts to stage a recovery
- DOGE on-chain metrics indicate the top meme coin is recovering well from last Monday's market sell-off.
- DOGE's attempt to recover could be hindered by a descending trendline that started in April.
- The 200-day SMA could serve as a key resistance after a recent "Death Cross" signal.
- A rally above the $0.130 level will invalidate the bearish thesis.

Dogecoin (DOGE) is up 0.5% on Monday as it attempts to stage a comeback from last week's market decline. In the past week, DOGE rallied 25% amid signs of recovery visible across its on-chain metrics. However, the technical side shows that key indicators could hamper DOGE's road to recovery.
DOGE on-chain metrics signal recovery
Dogecoin is trading around the $0.106 key level, where investors accumulated 14.5 billion DOGE tokens, according to IntoTheBlock's data. Such heavy accumulation zones often act as key support levels when the market turns bearish.
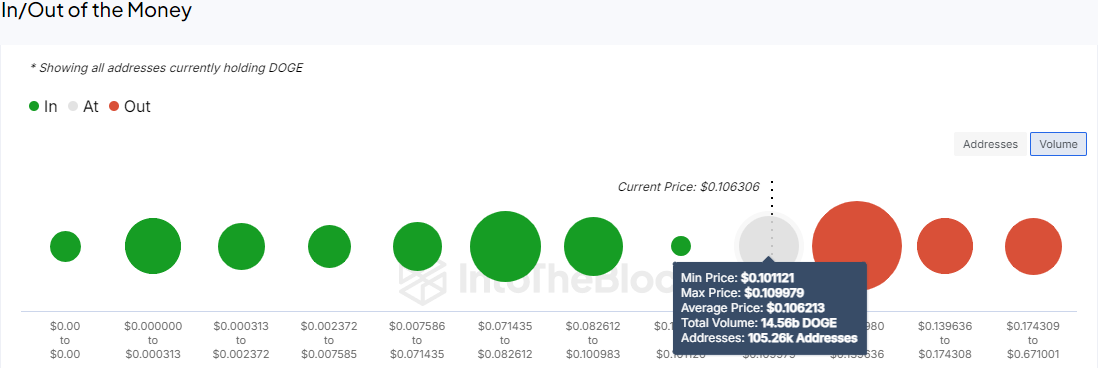
DOGE In/Out of the Money
DOGE's 30-day Market Value to Realized Value (MVRV) Ratio is hovering around -3%, rising from -16% in the past week. This indicates that all investors who bought DOGE within the last 30 days are still at an average loss of 3%.
The Santiment Weighted Sentiment indicator helps capture a balanced overview of an asset's social volume combined with investor sentiment. The indicator spikes — with 10 as the maximum — when there's increased social volume around an asset and the messages are largely positive. It dips when the volume is still high but the sentiment is negative. If the social volume is high but the sentiment is mixed, it stays around 0. If the volume is low, it also stays around 0.
The chart below indicates that Dogecoin’s Weighted Sentiment increased to 3.56 over the weekend before a slight downturn to 1.30.
 [15.43.03, 12 Aug, 2024]-638590770395786355.png)
DOGE On-chain Metrics
Despite DOGE's on-chain metrics indicating a recovery, a few technical indicators and trends paint a somewhat bearish view.
DOGE could stay below descending trendline
DOGE is attempting another move to break the resistance around $0.111 on the 8-hour chart after experiencing a rejection on Sunday.
DOGE's Relative Strength Index (RSI) is at 50 and has crossed above its moving average, indicating a short-term bullish momentum. If the RSI momentum helps DOGE to clear the $0.111 resistance, it faces another hurdle around a descending trendline that began on April 8. This trendline has been a key resistance in the past four months, having rejected a rally in May and July. This resistance could hold for the next few weeks.
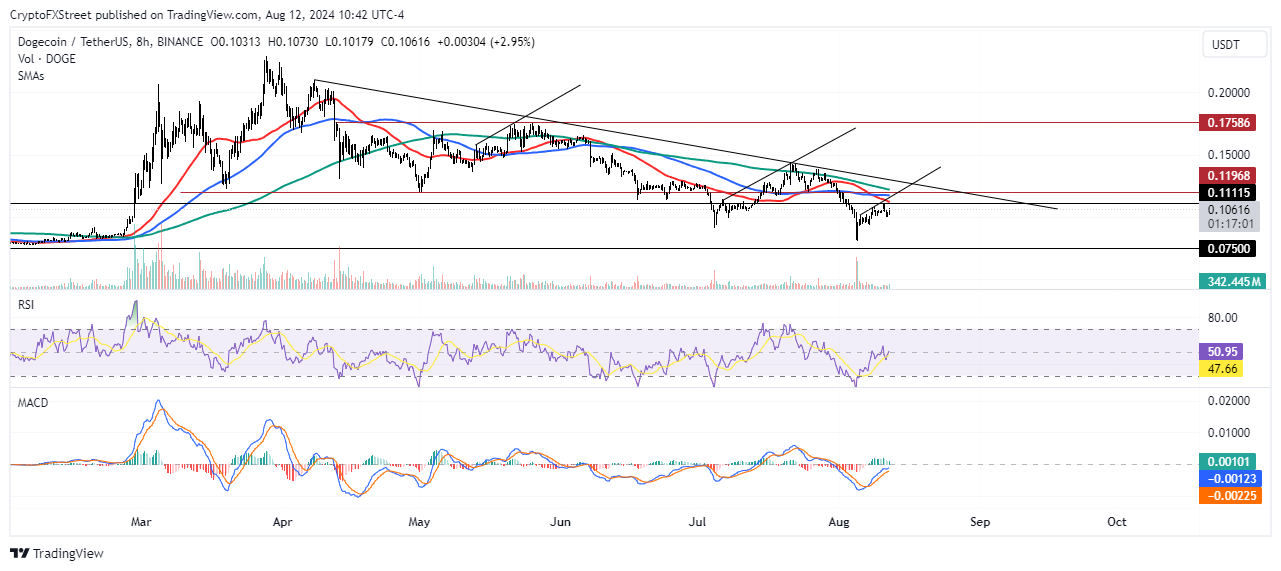
DOGE/USDT 8-hour chart
Meanwhile, DOGE saw a “Death Cross" on Thursday after its 50-day Simple Moving Average (SMA) crossed below its 200-day SMA. This often indicates the confirmation of a downward trend as it implies that the short-term trend (50-day SMA) is weaker than the long-term trend (200-day SMA). Hence, the 200-day SMA could serve as another key point for DOGE to see a rejection in case of a rally.
The bearish thesis will be invalidated if DOGE rallies above the $0.130 psychological level.
This analysis is also subject to Bitcoin's price performance as most cryptocurrencies often mimic its price movement.
Author

Michael Ebiekutan
FXStreet
With a deep passion for web3 technology, he's collaborated with industry-leading brands like Mara, ITAK, and FXStreet in delivering groundbreaking reports on web3's transformative potential across diverse sectors. In addition to


