Top 3 Price Prediction Bitcoin, Ethereum, Ripple: Bitcoin shows signs of weakness
- Bitcoin price continues to decline as it faces rejection around its resistance barrier.
- Ethereum price looks set for a downturn as it encounters resistance around the $2,843 level.
- Ripple price finds stability around the daily support level of $0.544, with potential recovery on the cards.

Bitcoin (BTC) and Ethereum (ETH) prices show weakness as they retested their key resistance levels. On the other hand, Ripple (XRP) is showing stability as it approaches its key support area, indicating the potential for a recovery.
Bitcoin price continues to decline after testing its resistance barrier
Bitcoin price retested the 61.8% Fibonacci retracement level of $62,066, drawn from the swing high of $70,079 on July 29 to the low of $49,101 on August 5 on Tuesday. BTC was rejected and declined by 5% in the following two days. As of Friday, it trades slightly higher by 1% at $58,231.
If BTC continues to face resistance at the $62,066 level, it could crash 14% from its current trading level at $58,231 to retest its daily support at $49,917.
On the daily chart, the Relative Strength Index (RSI) and Awesome Oscillator (AO) trade below their neutral levels of 50 and zero, respectively, suggesting an impending bearish trend.
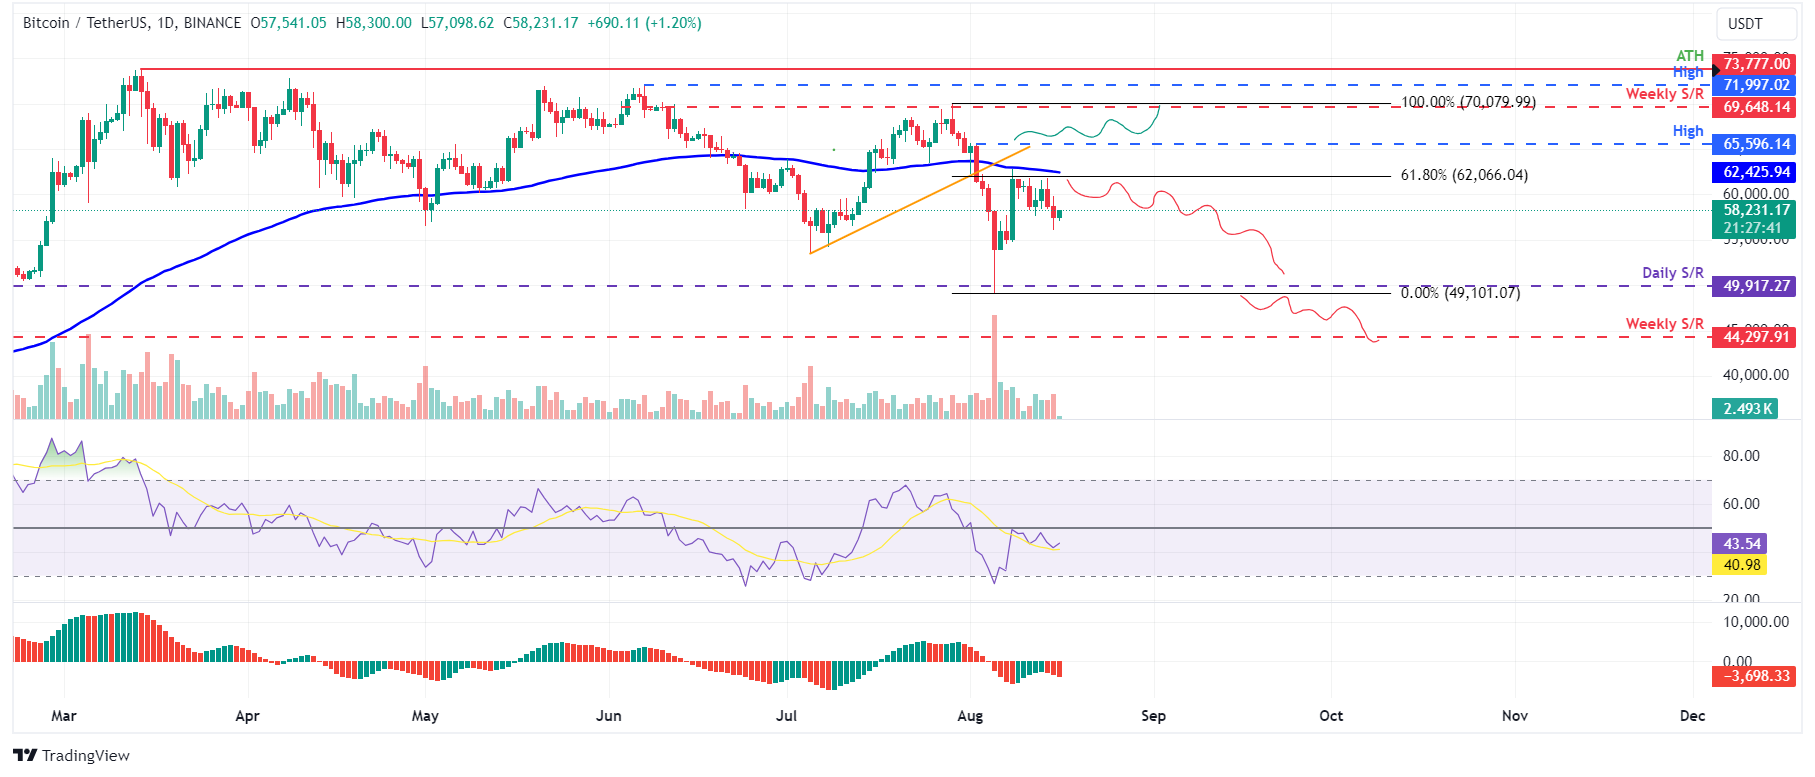
BTC/USDT daily chart
However, if Bitcoin's price can close above the August 2 high of $65,596, it would set a higher high on the daily chart, possibly leading to a 6% price increase and testing the weekly resistance at $69,648.
Ethereum is poised for rejection after retesting key resistance level
Ethereum price retested around its 50% retracement level of $2,843 (drawn from the swing high of $3,562 on July 22 and the swing low of $2,124 on August 5) on Wednesday. ETH was rejected and declined by 3.5% the next day. As of Friday, it trades slightly higher by 0.74% at $2,589.
If the $2,843 level holds as resistance and ETH continues to decline, it could crash 18% from the current level towards $2,589 and retest its weekly support level of $2,118.
On the daily chart, the RSI and AO trade below their neutral levels of 50 and zero, respectively, suggesting an impending bearish trend.
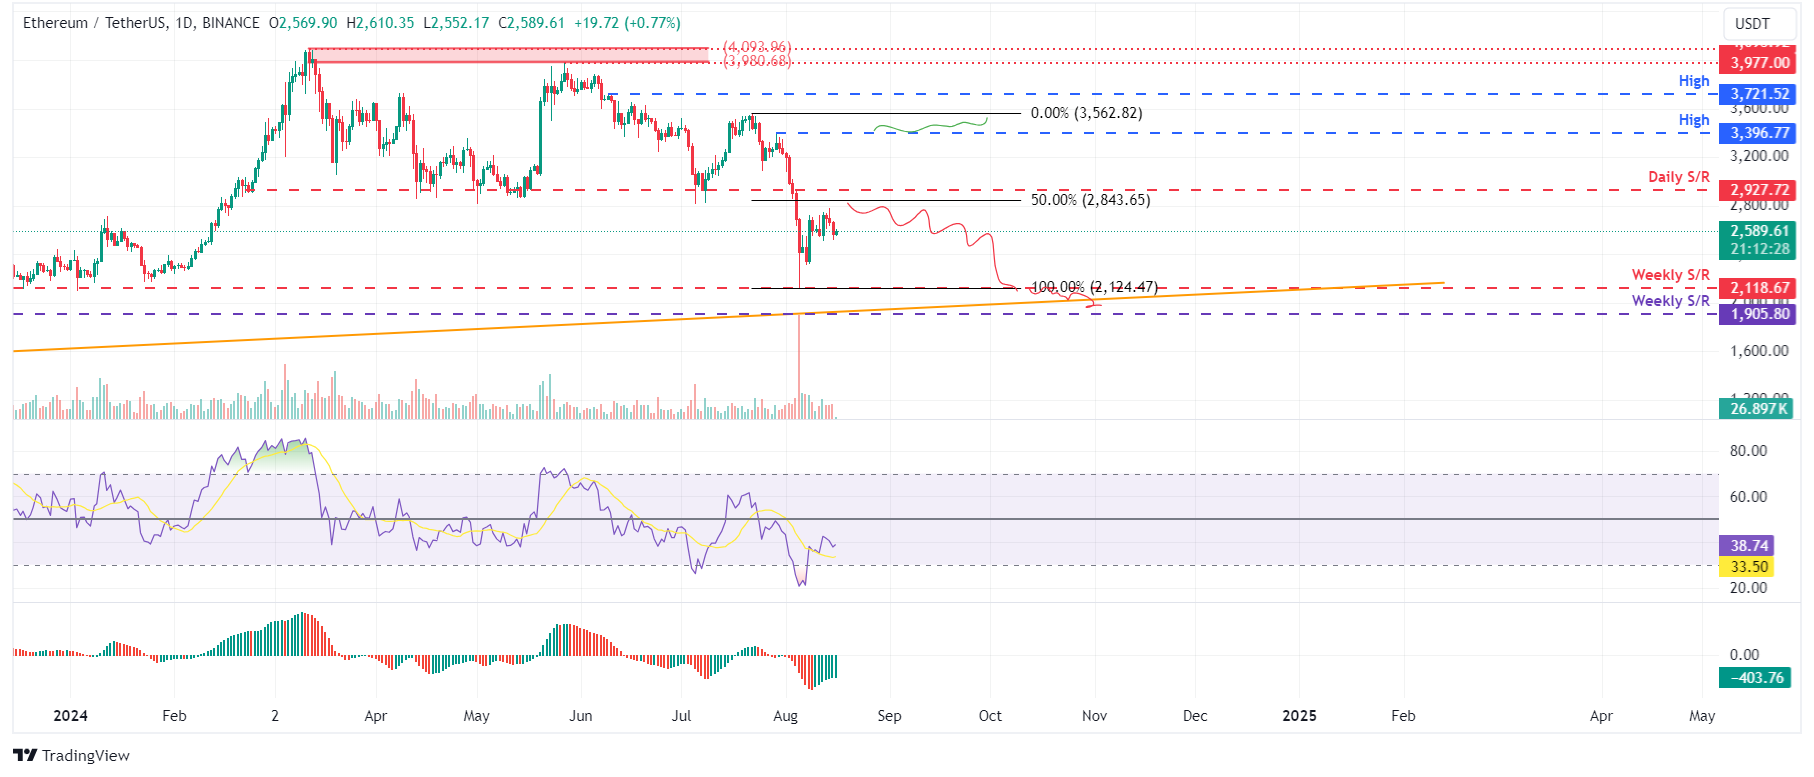
ETH/USDT daily chart
On the other hand, if Ethereum's price closes above the July 29 high of $3,396, it will establish a higher high on the daily chart, potentially driving a 5% increase to revisit the July 22 high of $3,562.
Ripple price shows potential for a rally after finding support around the daily level
Ripple price was retested, and support was found around its daily support level of $0.544 on Thursday. As of Friday, it trades slightly higher by 1.2% at $0.566.
If the daily support at $0.544 holds, XRP could rally 10% to challenge the next resistance level at $0.643.
The daily chart's RSI and AO have briefly slipped below their neutral levels of 50 and zero, respectively. If bulls are indeed making a comeback, then both momentum indicators must maintain their positions above their respective mean levels. Such a development would add a tailwind to the recovery rally.
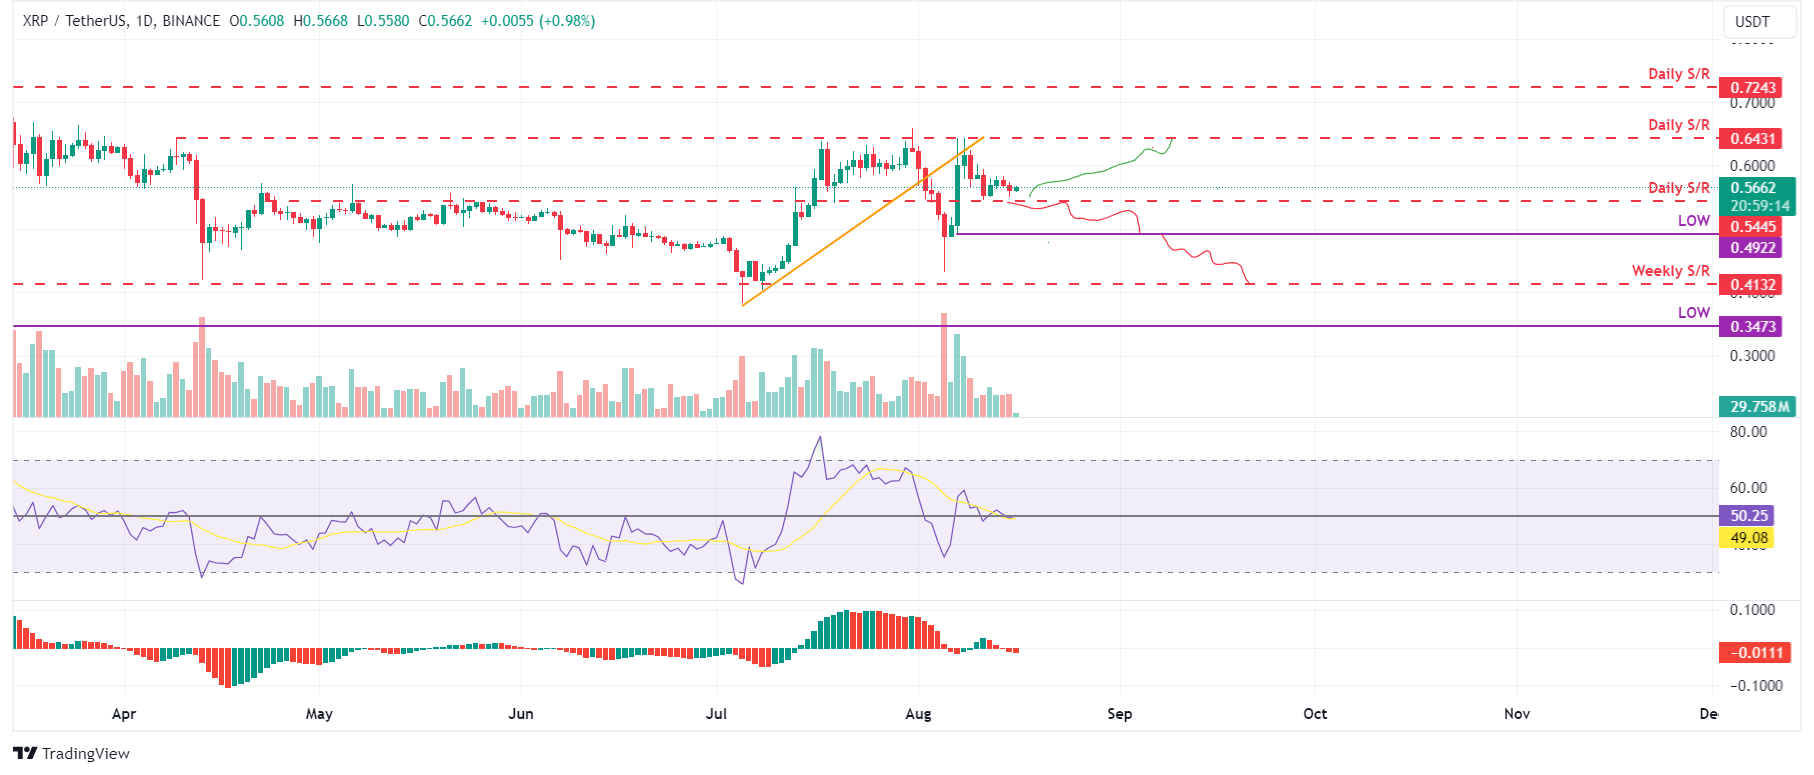
XRP/USDT daily chart
Conversely, if Ripple's price closes below the $0.544 daily support level, it would shift the market structure by creating a lower low on the daily chart, potentially leading to a 9.5% decline to revisit the August 7 low of $0.492.
Author

Manish Chhetri
FXStreet
Manish Chhetri is a crypto specialist with over four years of experience in the cryptocurrency industry.


