Dogecoin Price Analysis: DOGE stalls ahead of 38% technical breakout
- Dogecoin is facing short-term resistance at the 100 SMA and 200 SMA on the 4-hour hour chart.
- A colossal breakout awaits DOGE amid the formation of a symmetrical pattern.
- Improving network growth is a bullish signal; hence the uptrend may stay intact.
- Massive losses will occur if the immediate 50 SMA support fails to hold.

Dogecoin bulls have been keen on recovery since the price drop at the beginning of March. However, the momentum continues to lose steam, leading to lethargic price action. DOGE must break above a critical seller congestion zone to open the door for a huge technical liftoff.
Dogecoin triangle breakout eyes $0.07
The 4-hour chart illustrates the formation of a symmetrical triangle pattern. This pattern is arrived at by drawing two trendlines, with one connecting a series of declining peaks and the other linking ascending troughs. The symmetrical triangle highlights a consolidating asset ahead of either a breakout or breakdown.
If the price slices through the upper trendline, a breakout occurs. On the other hand, a breakdown will take place if the price slides below the lower trendline. Meanwhile, DOGE is heading toward a breakout, likely to catapult it 38% north to $0.07. However, bulls must focus on stepping above the key hurdle at the 100 SMA and 200 SMA.
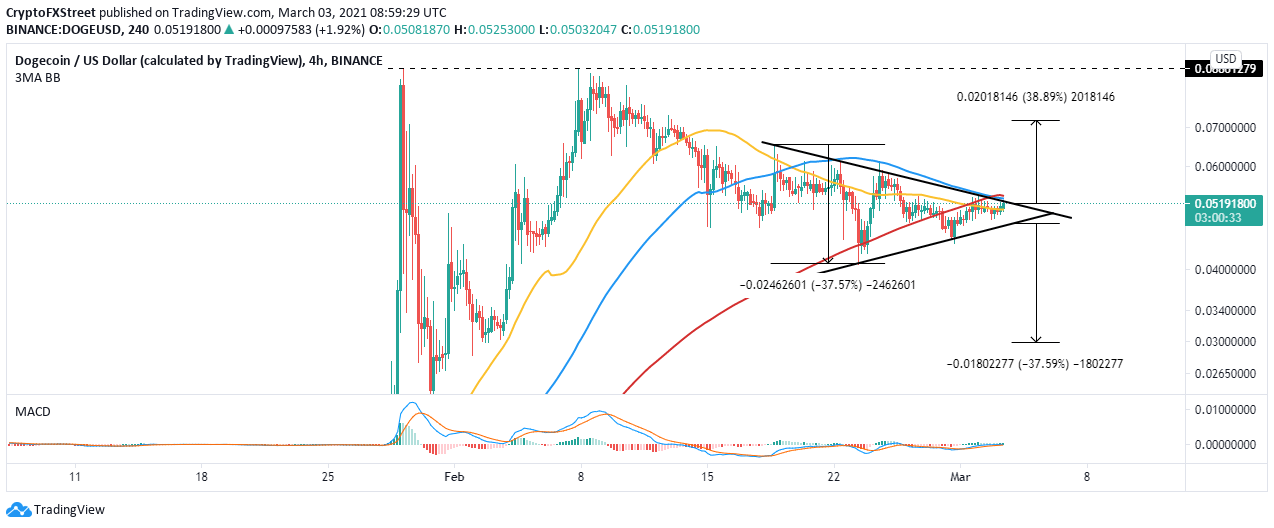
DOGE/USD 4-hour chart
The Moving Average Convergence Divergence (MACD) adds weight to the bullish outlook. In addition to crossing above the mean line, the MACD line (blue) has stepped above the signal line. Increasing the divergence between the indicator and the signal line will also validate the upswing.
According to IntoTheBlock’s “Daily New Addresses” model, Dogecoin’s persistent recovery is supported from an on-chain perspective. For instance, the number of unique addresses on the network has improved after falling to roughly 33,000 on February 23. Currently, an average of 42,000 newly-created addresses join the network daily.
Positive network growth is a bullish signal and also shows that the protocol mainstream adoption is expanding. If the metric consistently rises, Dogecoin’s uptrend will remain in place.
-637503615397517231.png)
Dogecoin network growth
Looking at the other side of the fence
The 4-hour chart shows Dogecoin trading at $0.05 and holding firmly to the support provided by the 50 SMA. If this support is broken, overhead pressure will rise, forcing DOGE to retest the triangle’s lower trendline. It is worth noting that a massive breakdown to $0.03 will take place if the price slices through the technical support.
Author

John Isige
FXStreet
John Isige is a seasoned cryptocurrency journalist and markets analyst committed to delivering high-quality, actionable insights tailored to traders, investors, and crypto enthusiasts. He enjoys deep dives into emerging Web3 tren


