- Dogecoin recovery is gradual but consistent, as bulls stream back into the market.
- A symmetrical triangle pattern on the 4-hour chart hints at a 35% upswing to $0.07.
- A sell signal on the 4-hour chart could jeopardize the expected rally.
Dogecoin bulls are persistently pushing for recovery after the recent slump to $0.04. The liftoff from this support has not been drastic, but buyers are consistently returning to the market. Initially, resistance at $0.06 hindered recovery leading to a dive to $0.04. However, the uptrend has been renewed, and Dogecoin is getting closer to a massive upswing.
Dogecoin on the verge of another breakout
The cryptoasset is dancing within the confines of a symmetrical triangle, printed on the 4-hour chart. This technical pattern does not have a bullish or bearish bias. It is formed after a significant move in price followed by a period of consolidation.
Two trendlines are drawn: one connecting consecutive declining peaks, and the other links a series of ascending lows. Usually, a breakout or breakdown takes place before the trendlines meet. Symmetrical triangles are distinct for their exact targets after the breakout, measured from the pattern's highest to lowest points. In this case, DOGE is nearing a potential 35% liftoff to $0.07.
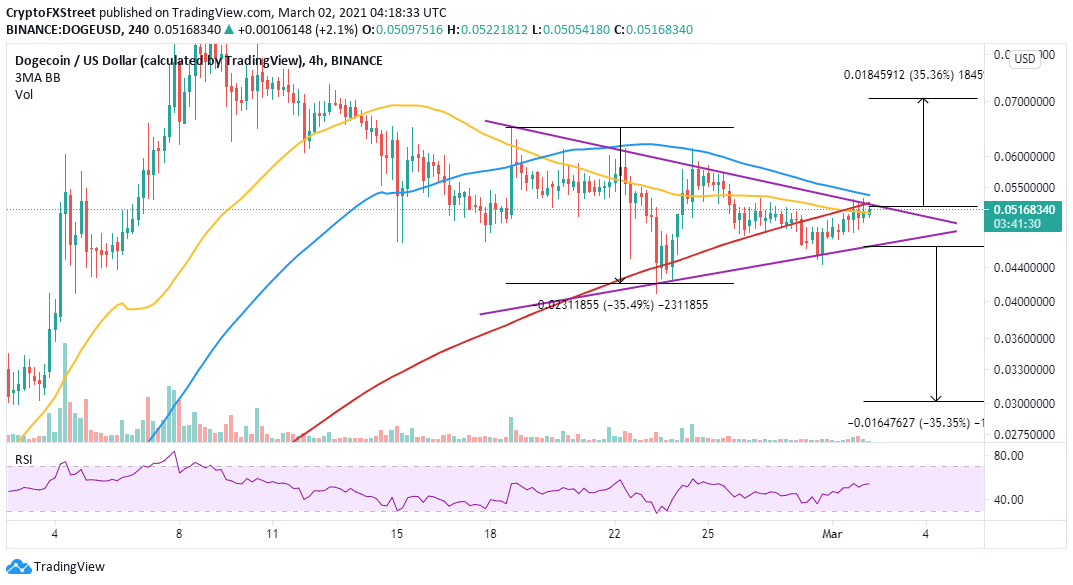
DOGE/USD 4-hour chart
The bullish outlook is currently supported by the Relative Strength Index (RSI) on the 4-hour chart. The trend strength indicator has a positive gradient toward the overbought region. As it gains ground, buyers get more confident, ready for the breakthrough to the all-time highs.
Looking at the other side of the fence
The TD Sequential indicator has recently flashed a sell signal on the 4-hour chart, hinting at overhead pressure intensifying in the near-term. This call to sell occurred in a green nine candlestick. If validated, we can anticipate Dogecoin's fall in one to four 4-hour candles and perhaps retest the support at $0.044 and $0.04, respectively.
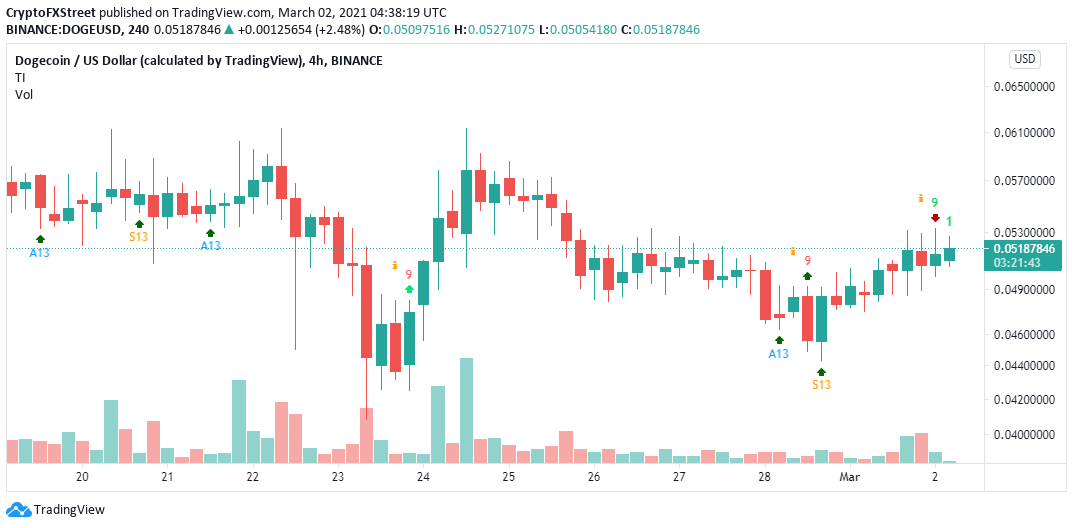
DOGE 4-hour chart
It is worth mentioning that the symmetrical triangle can lead to a breakdown with the same 35% target to $0.03. Immediate support by the 50 Simple Moving Average must be protected to avoid the possible dip. Otherwise, closing the day below the moving average could pave the way for retesting the triangle support, risking a freefall to $0.03.
Information on these pages contains forward-looking statements that involve risks and uncertainties. Markets and instruments profiled on this page are for informational purposes only and should not in any way come across as a recommendation to buy or sell in these assets. You should do your own thorough research before making any investment decisions. FXStreet does not in any way guarantee that this information is free from mistakes, errors, or material misstatements. It also does not guarantee that this information is of a timely nature. Investing in Open Markets involves a great deal of risk, including the loss of all or a portion of your investment, as well as emotional distress. All risks, losses and costs associated with investing, including total loss of principal, are your responsibility. The views and opinions expressed in this article are those of the authors and do not necessarily reflect the official policy or position of FXStreet nor its advertisers. The author will not be held responsible for information that is found at the end of links posted on this page.
If not otherwise explicitly mentioned in the body of the article, at the time of writing, the author has no position in any stock mentioned in this article and no business relationship with any company mentioned. The author has not received compensation for writing this article, other than from FXStreet.
FXStreet and the author do not provide personalized recommendations. The author makes no representations as to the accuracy, completeness, or suitability of this information. FXStreet and the author will not be liable for any errors, omissions or any losses, injuries or damages arising from this information and its display or use. Errors and omissions excepted.
The author and FXStreet are not registered investment advisors and nothing in this article is intended to be investment advice.
Recommended Content
Editors’ Picks

Is Ethereum's comeback real?
Ethereum price hovers above $2,500 on Friday after soaring nearly 100% since early April's bottom. The ETH Pectra upgrade has boosted over 11,000 EIP-7702 authorizations in a week, indicating healthy uptake by wallets and dApps. The growing stablecoin usage and tokenization, Layer 2 institutionalization and ETH short unwind support the price rally.

Bitcoin Weekly Forecast: BTC stabilizes near $103,000 amid trade optimism, rising institutional demand
Bitcoin price stabilizes around $103,000 on Friday after facing multiple rejections at the key $105,000 resistance level throughout the week. Risk-on sentiment prevails, driven by global trade deals, strong corporate accumulation, and spot ETF inflows.

EOS price climbs as sentiment improves following $3 million purchase by President Trump's World Liberty Financial
EOS price rebounds from short-term support at $0.75, boosting bullish sentiment amid broader market consolidation. President Donald Trump's World Liberty Financial purchases $3 million worth of EOS at an average price of $0.82.

FTX creditors set to receive over $5 billion in recovery plan payout handled by Kraken and BitGo
Defunct crypto exchange FTX will distribute $5 billion to holders of allowed claims starting May 30. Creditors with completed pre-distribution requirements will receive between 54% and 120% of their original claims.

Bitcoin: BTC stabilizes near $103,000 amid trade optimism, rising institutional demand
Bitcoin (BTC) price stabilizes at around $103,000 when writing on Friday, after facing multiple rejections at the key $105,000 resistance level throughout the week.