DigiByte Price Prediction: DGB poised for a massive comeback
- DigiByte gets ready for hefty price action if the short-term hurdle is pulled down at $0.022.
- An increase in volume supports DGB/USD uptrend, hence the bullish outlook.

DigiByte seems to be getting ready for an upswing following extended declines since September. The downtrend has been constrained in a descending parallel channel. Meanwhile, support at $0.18 in conjunction with the channel’s lower boundary allowed the bulls to take back control, commencing the undergoing recovery.
At the time of writing, DGB is doddering just below $0.022 after taking down the resistance at the descending channel middle boundary. All eyes are glued on breaking past the upper border, which coincides with the 50 Simple Moving Average (SMA).
If the cryptoasset closes above the 50 SMA, DigiByte buyers will shift their focus to the 100 SMA around $0.024. Such a move would be massive for the token and is bound to attract attention, in turn, creating the volume required for an enormous uplift, perhaps above $0.03.
The Moving Average Convergence Divergence (MACD) doubles down on the bullish outlook as it grinds towards the midline. A positive divergence is incoming above the MACD, which adds credence to the uptrend.

DGB/USD 12-hour chart
The 4-hour chart shows DigiByte sitting above the 50 SMA, hence the likelihood of a rally past $0.022 occurring. DGB might take a breather before continuing with the uptrend, as observed with the Relative Strength Index (RSI).
The rest of the journey to $0.03 will depend on the crypto’s ability to take down the seller congestion at the 100 SMA, 200 SMA, and the critical level at $0.287. Nonetheless, buyers still have control over the price.
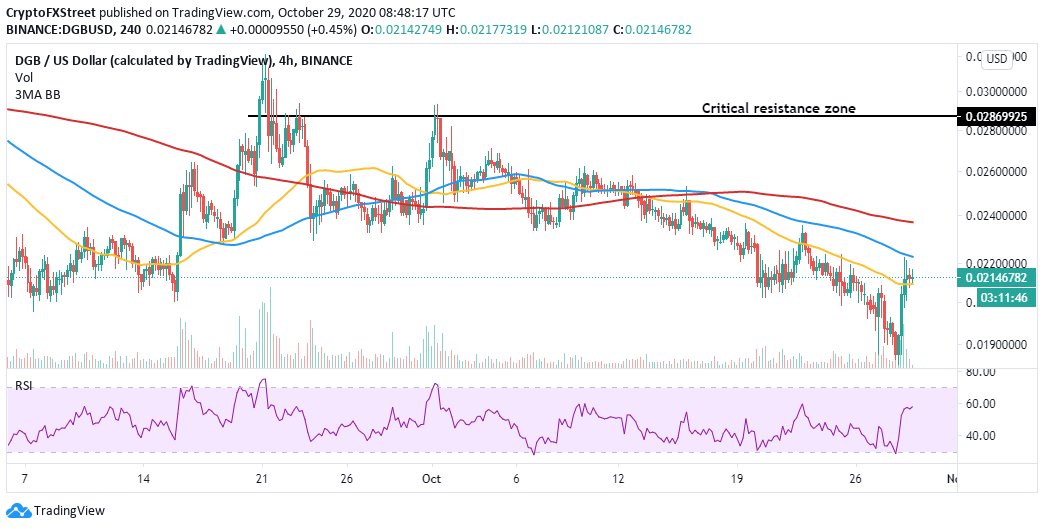
DGB/USD 4-hour chart
According to Santiment, the volume is already building in support of the DGB/USD growing uptrend. A correlation exists between volume and price action for this token. Therefore, as long as the volume surges, the rally above $0.022 and towards $0.03 would start to materialize.
 [11.57.27, 29 Oct, 2020]-637395607923617784.png)
DGB volume chart
Looking at the other side of the picture
It is worth mentioning that if DGB/USD fails to hold above the 50 SMA in the 4-hour time frame, a correction will come into play, sending the price downstream towards $0.02. Besides, rejection at the 100 SMA may jeopardize the expected outcome. The volume must also continue to build in support of the uptrend; otherwise, losses might come into the picture.
Author

John Isige
FXStreet
John Isige is a seasoned cryptocurrency journalist and markets analyst committed to delivering high-quality, actionable insights tailored to traders, investors, and crypto enthusiasts. He enjoys deep dives into emerging Web3 tren


