Chainlink price to complete its 33% rally, but what comes next could surprise you
- Chainlink price eyes a retest of the range high at $9.32 and vows to complete its 33% ascent.
- Investors should note that completion of this rally could produce a bearish triple tap setup.
- A flip of the $9.32 hurdle on a daily time frame will invalidate the bearish thesis for LINK.
-637336005550289133.jpg)
Chainlink price has shown incredible resilience as it flipped a crucial resistance barrier and continued its rally. This development is coming to an end as it approaches its target.
Chainlink price at inflection point
Chainlink price created a $6.38 to $9.32 range after crashing 43% between May 10 and May 12. This range has regulated the movement of bulls and bears since then. After creating multiple equal lows around the range low at $6.38, LINK triggered its rally on June 13 and has so far recovered 69% of its losses.
During this ascent, Chainlink price has sliced through the 30-day, 50-day and 100-day Exponential Moving Averages (EMAs) and is currently eyeing a retest of the range high at $9.32.
While this development is bullish, Chainlink price could rally another 8% to retest the range high, but due to multiple equal lows and Bitcoin’s inherently bearish outlook, things could come undone. Moreover, LINK seems to be forming a triple tap setup, which is a reversal pattern.
If the said setup is complete, Chainlink price could trigger a crash to $7.29 and, in a highly bearish case, sweep the range low at $5.28. Although this development might seem impossible considering the short-term bullish structure of the altcoins, market makers will likely push the altcoin lower to collect liquidity.
So, investors must be prepared for a complete undoing of the gains witnessed since June 13.
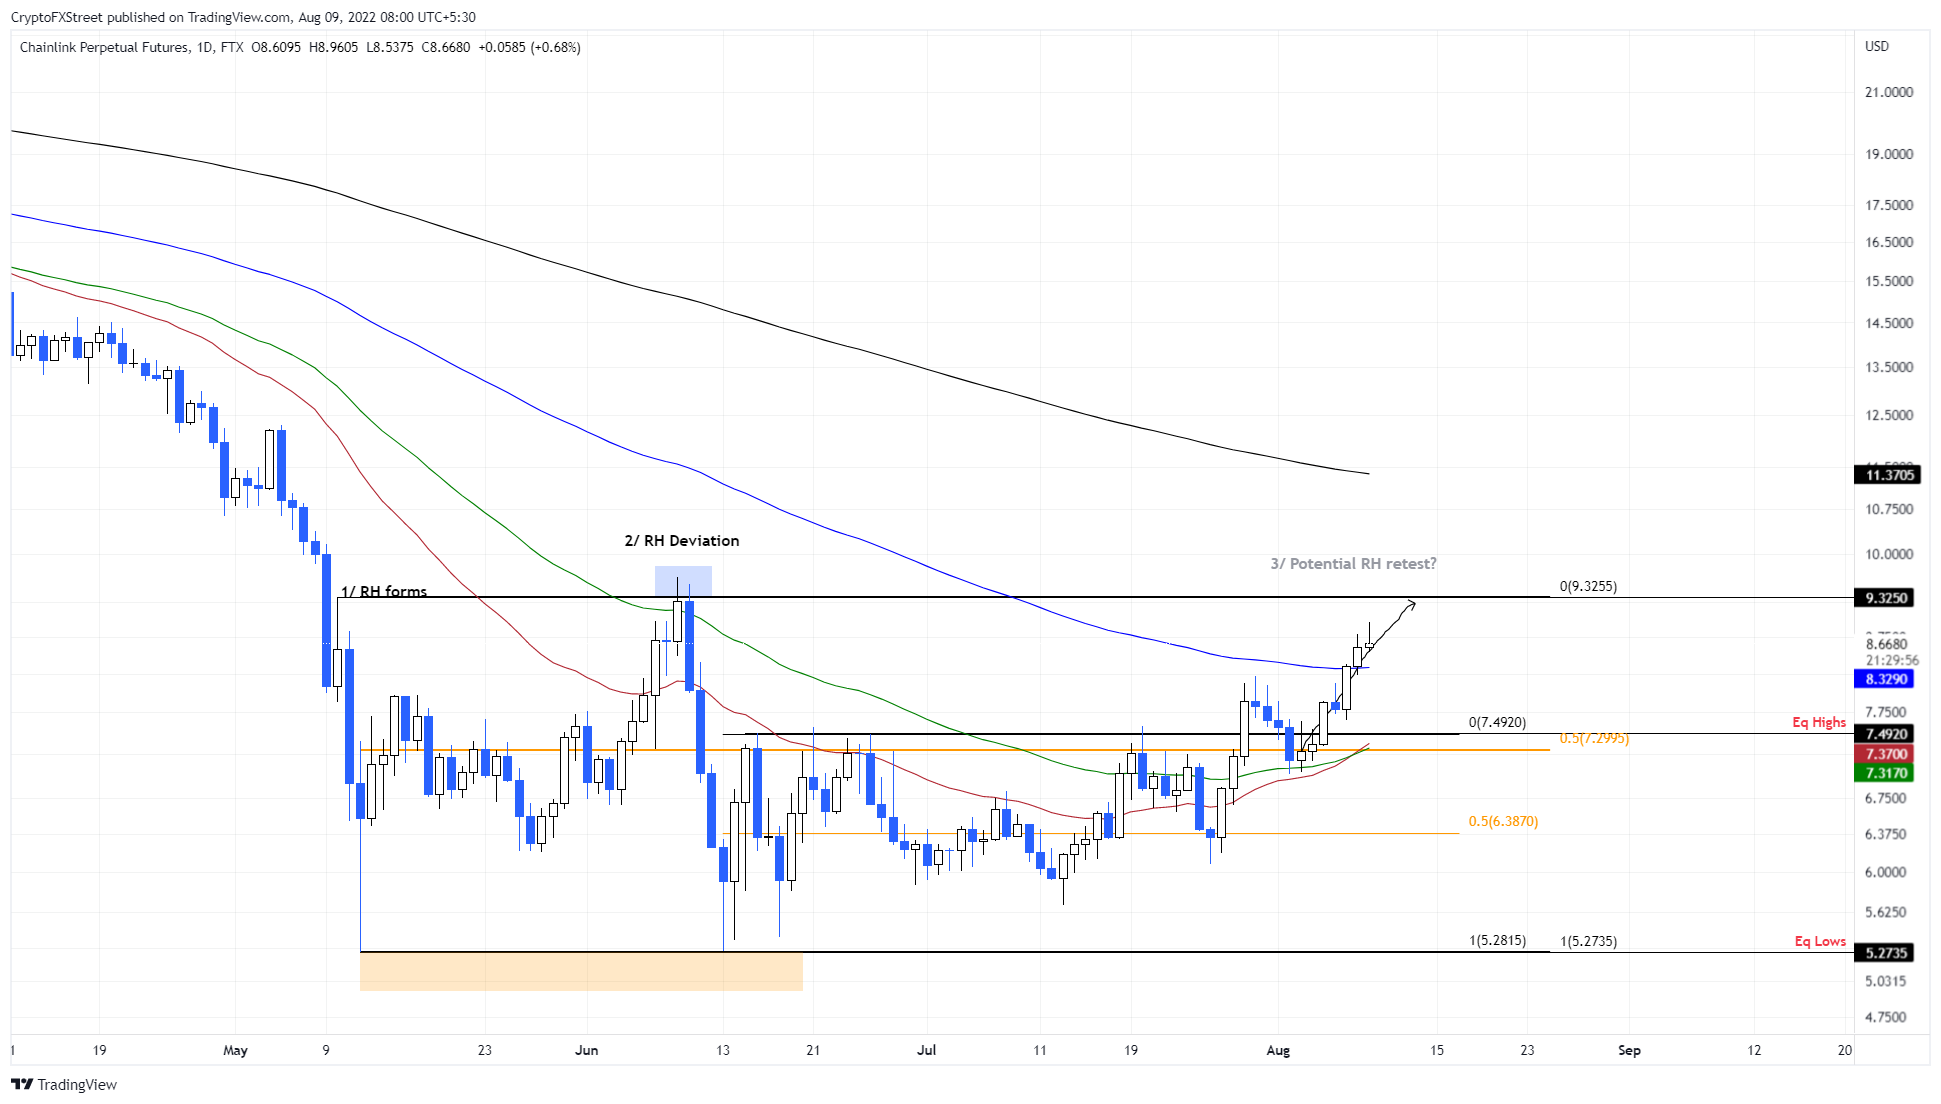
LINK/USDT 1-day chart
On the other hand, if Chainlink price produces a daily candlestick close above the range high at $9.32 and flips this level into a support floor, it will invalidate the bearish thesis for LINK.
This development could propel the oracle token to the 200-day EMA at $11.37.
Author

Akash Girimath
FXStreet
Akash Girimath is a Mechanical Engineer interested in the chaos of the financial markets. Trying to make sense of this convoluted yet fascinating space, he switched his engineering job to become a crypto reporter and analyst.



