Will this recent Chainlink price rally hold up, or should you sell?
- Chainlink price rallied 9% over the last twelve hours and is currently eyeing for the sweep of $7.49.
- Due to the multiple equal high formations at $7.49, this level is likely to be the next target for market makers.
- Failure to flip the $7.49 hurdle into a support floor could trigger a crash to sweep the equal lows formed at $5.27.
-637336005550289133.jpg)
Chainlink price shows an interesting setup with liquidity resting on both ends. This makes it hard to discern the next move, but under some conditions, the volatility seen on LINK can be taken advantage of.
Chainlink price at crossroads
Chainlink price created a massive range, extending from $5.27 to $9.32 as it crashed 43% between May 10 and May 12. Subsequently, LINK retested the range low at $5.27, creating equal lows and leaving a ton of liquidity resting below it as it rallied 42% in the following two weeks or so.
Since then, Chainlink price created a smaller range, extending from $5.27 to $7.49. Interestingly, the range high was retested not twice but thrice over the next few weeks, leaving a lot of buy-stop liquidity above it.
This particular situation for Chainlink price shows that there is liquidity resting below $5.27 and $7.49, making both these levels highly sought-after. However, due to the FOMC meeting, altcoins rallied quite a bit and are currently trying to discern their next move.
A reversal of the recent and explosive move seems likely, but for LINK, such a development could come after a brief sweep of the $7.49 hurdle. This liquidity run could extend into a run-up if buyers manage to flip the said level into a support floor.
Such a development could see aim to fill the four-hour fair value gap, aka price inefficiency, at $7.99.
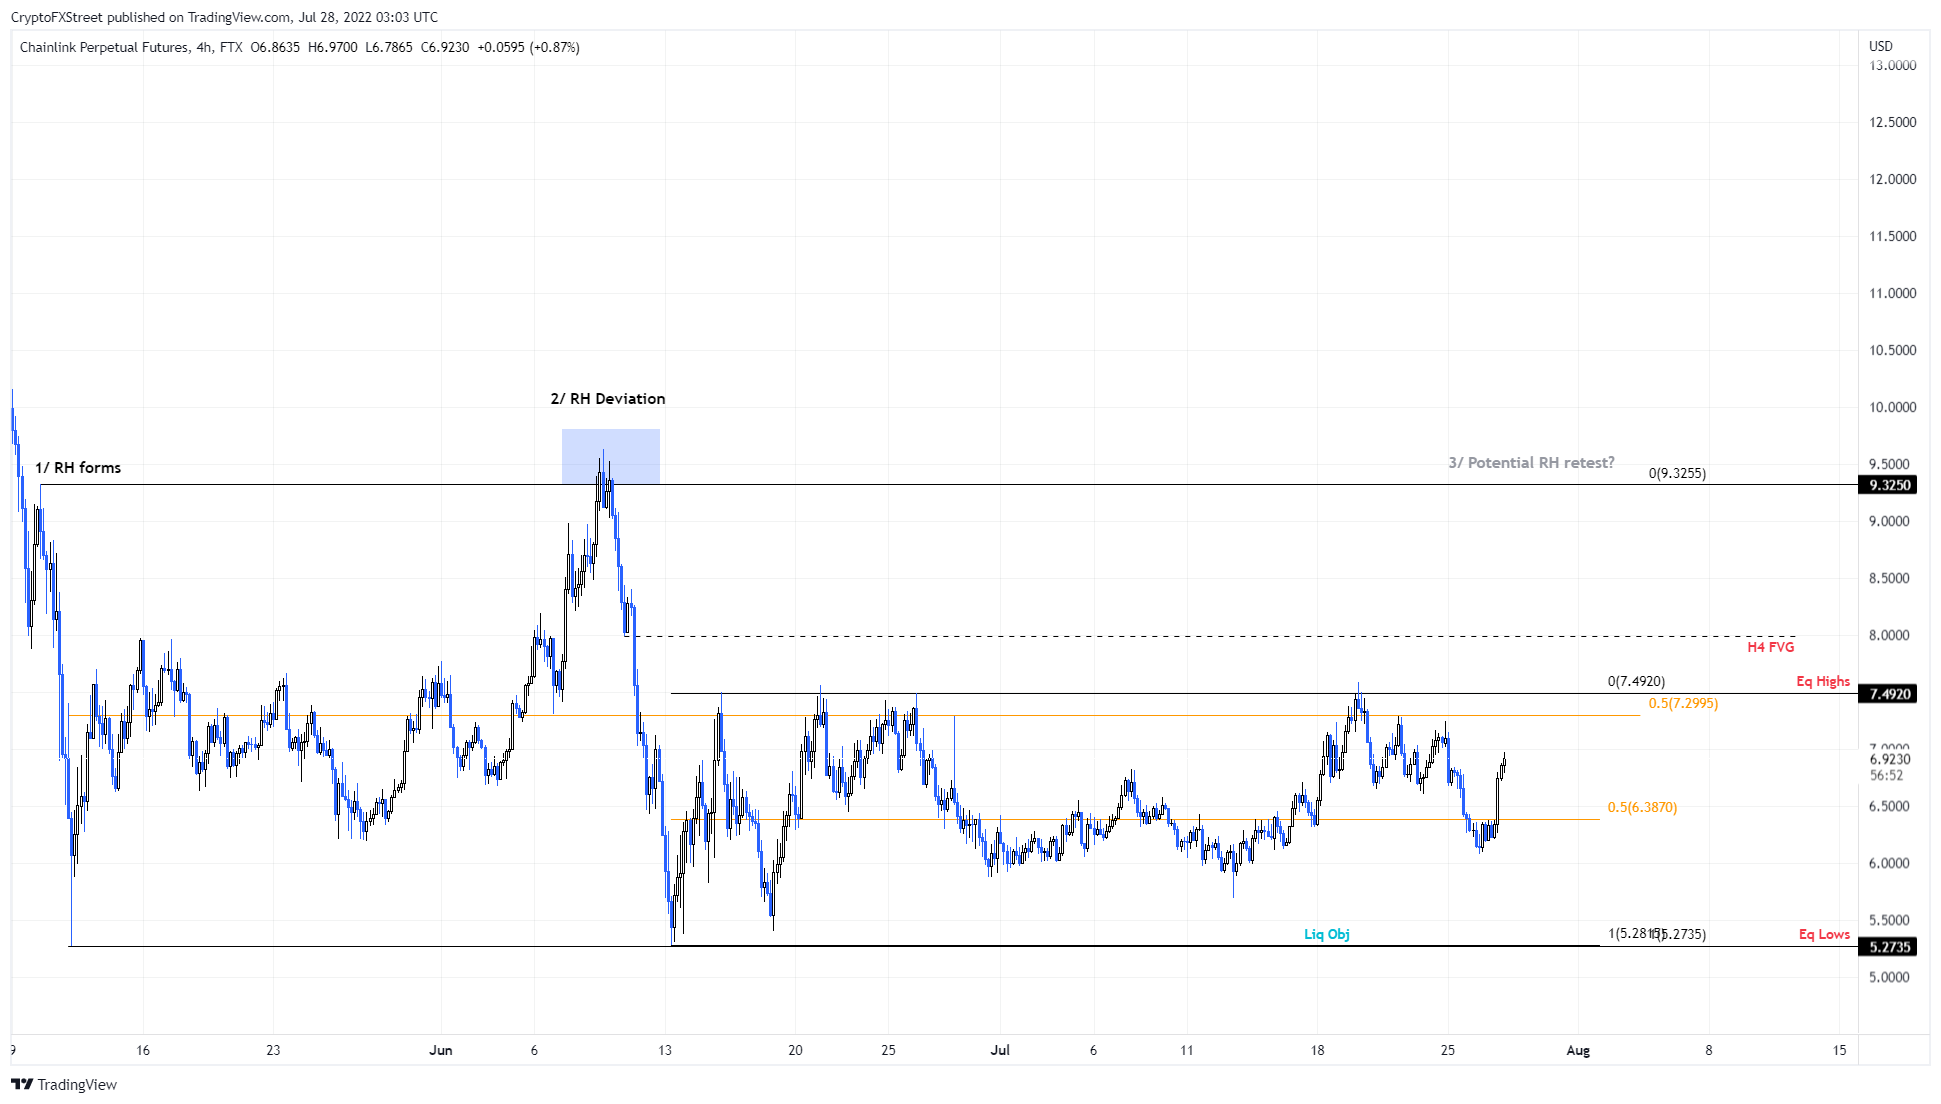
LINK/USDT 4-hour chart
On the other hand, investors should be cautious of a premature reversal of the FOMC rally. This development could send Chainlink price back to retest the 50% retracement level of the smaller range at $6.38.
In some cases, a downside move to collect the liquidity resting below equal lows at $5.27 might be possible. As long as LINK recovers above $5.27, this seemingly bearish move could be a sign that a major uptrend could be brewing for the oracle token.
However, if the $5.27 barrier is flipped into a resistance barrier, things could get ugly for Chainlink price.
Author

Akash Girimath
FXStreet
Akash Girimath is a Mechanical Engineer interested in the chaos of the financial markets. Trying to make sense of this convoluted yet fascinating space, he switched his engineering job to become a crypto reporter and analyst.



