Is it too late to be part of the Chainlink rally
- Chainlink price rallies 23% in days as markets look for a soft landing.
- LINK price is set to skyrocket towards $11 as bulls pick up the buying pace.
- Expect a sharp and quick rally as the RSI hits overbought.
-637336005550289133.jpg)
Chainlink (LINK) price has been on fire since last week with 23% gains already, in just a matter of days as investors focus on the possibility of rate cuts by the Fed, and as rumours emerge that inflation could be set to drop. The central theme, the tail risk for 2022, looks to start dropping and could become a tailwind instead of a headwind for global markets as a soft landing becomes one of the possibilities. LINK bulls are using the momentum to welcome back investors absent for over half a year and see the demand side exploding with buy-orders.
LINK price set to explode another 30%
Chainlink price has used the green ascending trend line from June 13 as a level to bounce off and boot-start the rally that is currently underway. As several European countries face another heat wave, the heat under LINK price action is on as well, and sees bulls buying everything in sight for fear of missing out. With this activity, the Relative Strength Index (RSI) nears the ‘overbought’ level and could soon break it, triggering some profit taking and cooling down the rally for now.
LINK price looks set to close above the monthly R1 resistance level and make a stretched rally towards $11.25 with the monthly R3 resistance and the 200-day Simple Moving Average as two bearish elements that will limit any further progress. The RSI will trade further into the oversold area, but not enough to slow down price’s steep ascent before hitting that upper target.
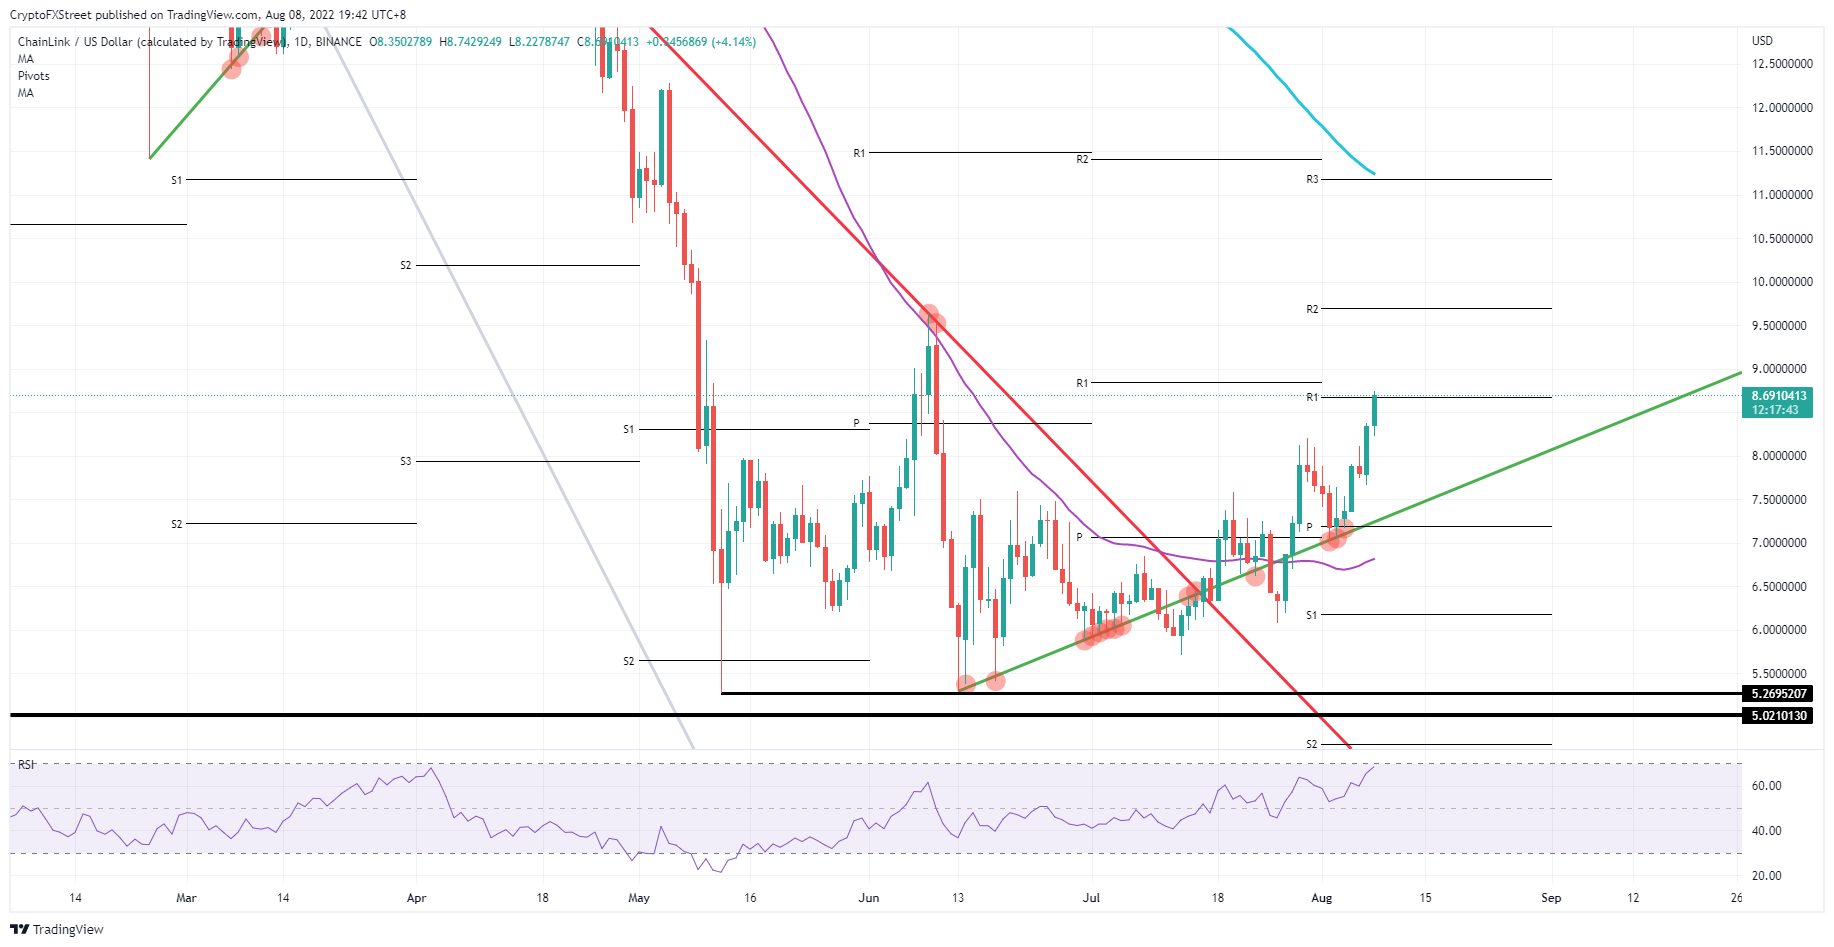
LINK/USD Daily chart
One element that would quickly halt the rally is the monthly R2 resistance level at $9.70, which falls in line with the June 9 top. LINK price action aggressively reversed after hitting that level and dropped a fierce 44% in just four trading days. The risk of repetition and the RSI being overbought could be reason enough to see a quick and sharp decline towards the green ascending trend line for support.
Author

Filip Lagaart
FXStreet
Filip Lagaart is a former sales/trader with over 15 years of financial markets expertise under its belt.



