Chainlink Price Prediction: LINK dances at the edge of a high cliff as breakdown under $20 looms
- Chainlink struggles to hold onto the support at the 100 SMA on the 4-hour chart as declines linger.
- The short-term technical picture has flipped bearish as the MACD crosses below the signal line.
- The bearish outlook is cemented by intense resistance ahead of LINK, as revealed by the IOMAP model.
- A buy signal by the TD sequential indicator on the 4-hour chart could see the uptrend's resumption.
-637336005550289133.jpg)
Chainlink is dealing with increased selling pressure, just like the majority of cryptocurrencies in the market. Overhead pressure began to surge following the most recent rejection at $31.5. Tentative support at the 50 Simple Moving Average did little to anchor the live price feed Oracle token from the ongoing breakdown.
Chainlink depends on crucial support to avert losses under $20
At the time of writing, Chainlink is trading at $26 while holding firmly to the immediate support provided by the 100 SMA. If bears slice through this short-term anchor zone, massive selling orders will be triggered as more sellers come in from the sidelines.
A comprehensive look at the Moving Average Convergence Divergence (MACD) hints at the bearish narrative lasting longer. Note that the MACD line (blue) is about to cross under the signal line, a formidable bearish signal. If the indicator generally falls towards the midline, Chainlink may retest the next key support, provided by the 200 SMA marginally below $20.
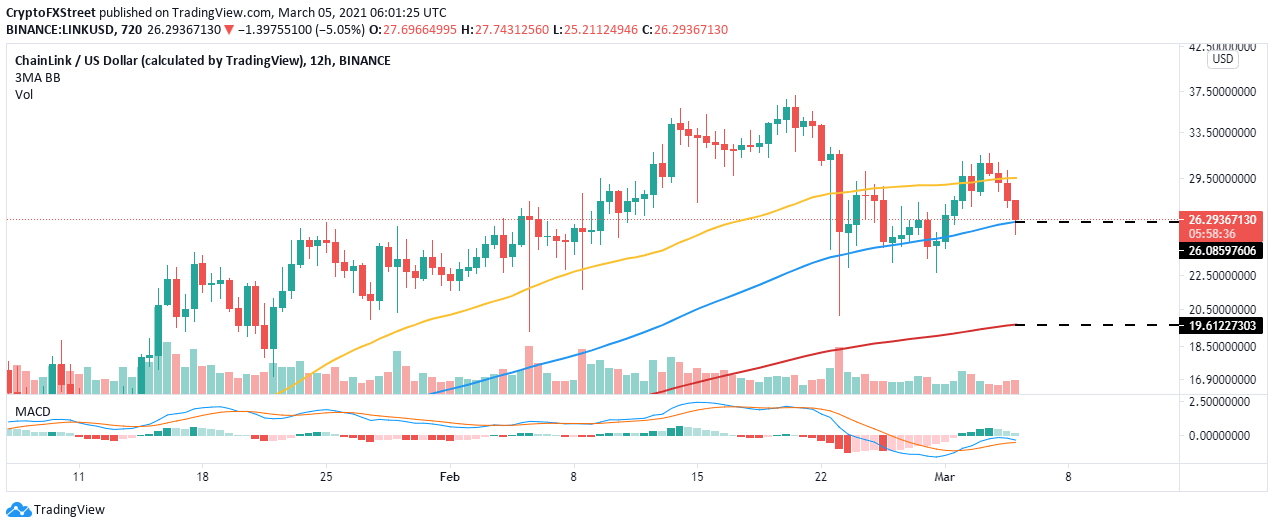
LINK/USD 12-hour chart
The IOMAP model by IntoTheBlock highlights intensifying selling pressure toward $30. This shows that recovery will either delay or take longer to materialize. The model directs our attention to the region between $28 and $29. Here, nearly 12,800 addresses had previously bought around 21.6 million LINK. The selling pressure in this area is likely to absorb the buying pressure in case of a recovery.
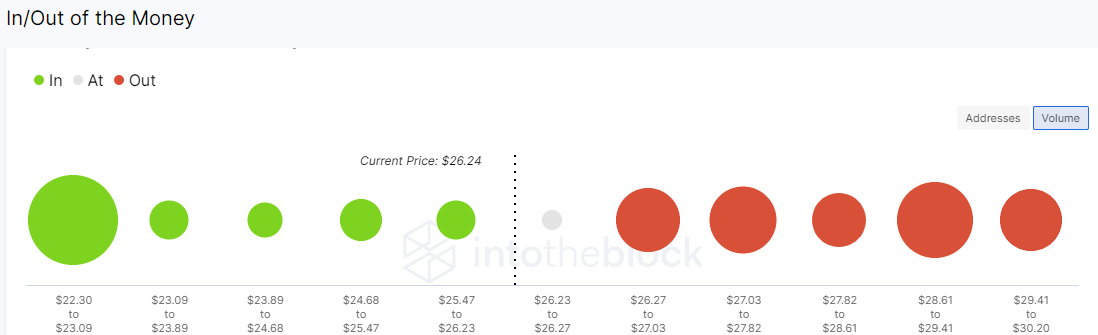
Chainlink IOMAP chart
On the downside, the IOMAP model shines a light on robust support, running from $22.30 and $23. Roughly 10,700 addresses are currently profiting from the nearly 34.3 million LINK bought within the price range. Holding above this may invalidate the downswing under $20.
Looking at the other side of the fence
The TD Sequential indicator has presented a buy signal on the 4-hour chart. This call to sell manifested in a red nine candlestick. The signal shows that selling pressure is fizzling out as buyers prepare to take control. If validated, Chainlink could recover in one to four 4-hour candles.
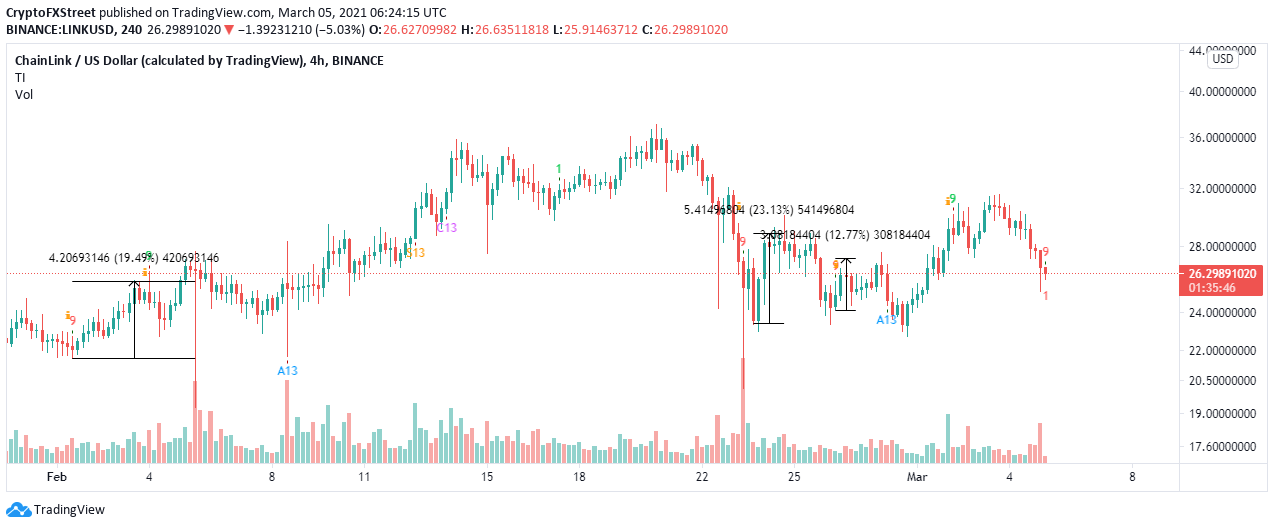
LINK/USD 4-hour chart
The 4-hour chart shows that most of Chainlink's buy signals get validated, leading to massive recovery moves. Therefore, it essential to look out for support, preferably the one highlighted by the IOMAP. Buyers are likely to build an uptrend from this level.
Author

John Isige
FXStreet
John Isige is a seasoned cryptocurrency journalist and markets analyst committed to delivering high-quality, actionable insights tailored to traders, investors, and crypto enthusiasts. He enjoys deep dives into emerging Web3 tren


