Chainlink Price Prediction: LINK on the brink of 36% retreat as network eyes higher scalability and decentralization
- Chainlink is getting ready for a massive breakdown amid the formation of a descending triangle.
- The network is looking forward to the next step in scalability with the launch of Off-Chain Reporting.
- The IOMAP reveals increased resistance ahead of LINK, which adds weight to the retracement.
- The MACD supports a bullish outlook suggesting that bulls still have a chance to take control of the trend.
-637336005550289133.jpg)
Chainlink seems to have found formidable support following the persistent retreat from highs around $36. Buyer congestion at $22 has played a key role in the ongoing recovery. However, with the formation of a descending triangle pattern, LINK is looking forward to a significant breakdown.
Chainlink is working toward the Oracle network upgrade
Chainlink has announced the development of an Off-Chain Reporting (OCR). The protocol will improve the existing Oracle network, the FluxAgrregator model and increase decentralization and scalability. According to the developers:
All nodes communicate using a peer-to-peer network. During the communication process, a lightweight consensus algorithm is run, in which every single node reports its price observation and signs it. A single, aggregate transaction is then transmitted, saving a significant amount of gas.
Chainlink is vulnerable to declines
Chainlink is trading at the apex of a descending triangle. This pattern usually gives a bearish impulse and suggests that LINK may be heading into a 36% downswing to $15. The triangle is a continuation pattern suggesting that the live price feed Oracle token will drop further.
Note that the 50 Simple Moving Average (SMA) on the 4-hour chart is likely to slice through the 200 SMA, bringing to light a death cross. Realize that the death cross is a bearish pattern formed when a shorter-term moving average crosses below a long-term moving average. In other words, this pattern would add credence to the bearish outlook.
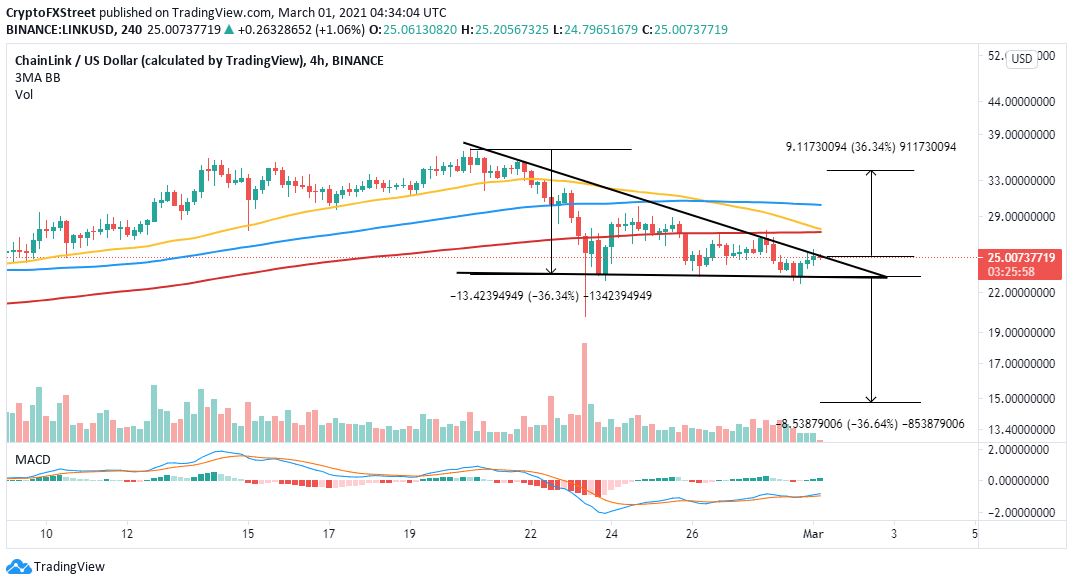
LINK/USD 4-hour chart
The IOMAP model by IntoTheBlock reveals that recovery back to the all-time high at $36 will not come easy, especially with the swelling resistance ahead of LINK. The region between $27 and $28 is the most robust seller congestion zone, where nearly 4,000 addresses had previously bought around 21.4 million LINK.
On the flip side, the same model highlights support above $20, suggesting that Chainlink could be stuck in consolidation before another major move. The most significant support runs from $21 to $22. Here, approximately 11,000 addresses had previously bought roughly 22.5 million LINK.
-637501726486400995.png)
Chainlink IOMAP chart
Looking at the other side of the fence
It is important to realize that there are instances when the descending triangle results in a bullish impulse. Buyers need to double-down their effort and purpose to break above $30, bringing Chainlink out of the woods. Moreover, the Moving Average Convergence Divergence (MACD) shows that a bullish uptrend is building.
Author

John Isige
FXStreet
John Isige is a seasoned cryptocurrency journalist and markets analyst committed to delivering high-quality, actionable insights tailored to traders, investors, and crypto enthusiasts. He enjoys deep dives into emerging Web3 tren


