Chainlink Price Forecast: LINK recovery on the rocks as a massive 45% slump beckons
- Chainlink is on the brink of an extensive breakdown, mostly if the ascending channel’s lower boundary support caves.
- A sell signal on the weekly chart hints at a significant reversal, perhaps refreshing August lows at $7.2.
-637336005550289133.jpg)
Chainlink is trading at $13 as the European session on Tuesday commences. The decentralized oracle price feed token has been struggling with sustaining the uptrend, following the rejection suffered at $16 towards the end of November. Losses to $7.2 are beckoning, likely to be confirmed by a breakdown under the ascending parallel channel.
Chainlink is dancing at the edge of a cliff
LINK is holding at the ascending parallel channel’s lower boundary. If bulls lose this support, massive sell orders would be triggered, forcing the token to seek another anchor. The 50 Simple Moving Average and the 100 SMA on the daily chart are in line to cushion Chainlink from dropping sharply. However, the most robust support sits at the 200 SMA, currently at $10.
The Relative Strength Index adds credibility to the bearish outlook after hitting a higher high, followed by a series of lower highs. Similarly, a break under the midline will call out sellers to increase their positions in anticipation of an extended price correction.
-637430060310041294.png)
LINK/USD daily chart
The TD Sequential indicator has flashed a sell signal in the form of a green nine candlestick on the weekly chart. The impact of the call to sell could be enormous as the previous signal in August saw Chainlink plunge by 64% to the support around $7.2. If validated, the bearish formation may see LINK dive in one to four daily candlesticks, confirming the correction.
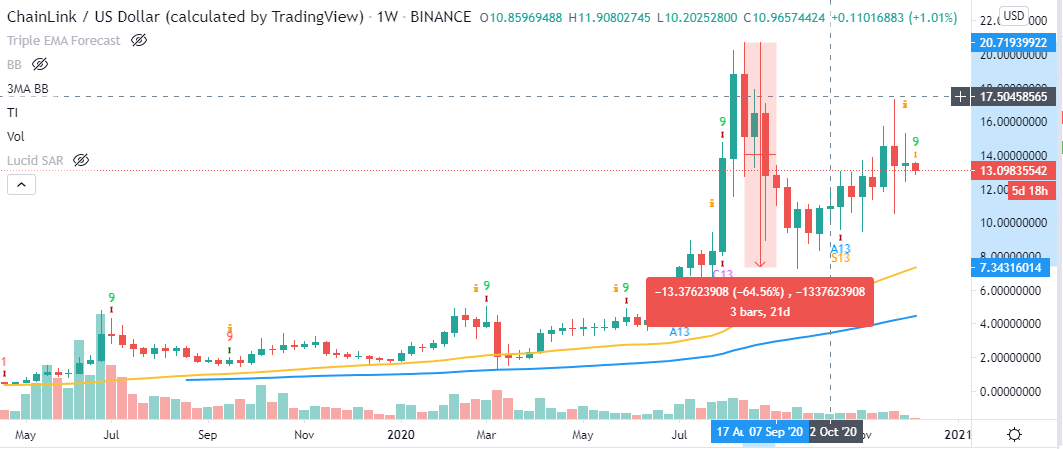
LINK/USD weekly chart
IntoTheBlock’s IOMAP model hints at consolidation taking precedence before Chainlink price moves significantly. From the current price level, a crucial hurdle has been formed at $13.2 to $13.5. Here, almost 13,000 addresses had previously bought roughly 22.4 million LINK. Trading above this zone might lift LINK to highs above $15.
-637430060781978611.png)
Chainlink IOMAP chart
Robust support has also been created under Chainlink, suggesting that the expected breakdown is unlikely to hit $7.2. Nearly 8,400 addresses had previously bought approximately 37 million LINK in the range running from $11.6 to $12. Therefore, if LINK fails to clear the overhead resistance, consolidation might take precedence between $13 and $12.
Author

John Isige
FXStreet
John Isige is a seasoned cryptocurrency journalist and markets analyst committed to delivering high-quality, actionable insights tailored to traders, investors, and crypto enthusiasts. He enjoys deep dives into emerging Web3 tren


