Chainlink Price Prediction: LINK is on the brink of a 15% dump
- Chainlink will plummet to $11 if it closes the day under the 200 SMA on the 4-hour chart.
- The TD Sequential indicator might print a sell signal on the weekly chart in the coming week to confirm the freefall.
-637336005550289133.jpg)
Chainlink has been trading within a descending parallel channel since the beginning of December. The channels’ upper boundary continues to hinder growth while the lower limit assisted in mitigating the losses.
Meanwhile, LINK has slipped under the 200 Simple Moving Average and is likely to test the channel’s middle boundary. A massive breakdown might come into the picture if Chainlink dives under the descending channel.
Chainlink downside eyes $11
The Relative Strength Index confirms the bearish outlook after abandoning the recovery mission slightly under the midline. Declines are likely to catch momentum if the RSI slides closer to the oversold area.
On the other hand, closing the day under the 200 SMA as well as the channel’s middle boundary will add weight to the impending breakdown. The most significant blow would be to trade below the channel, which might call for more sell orders, leading to freefall to $11 (November’s support).
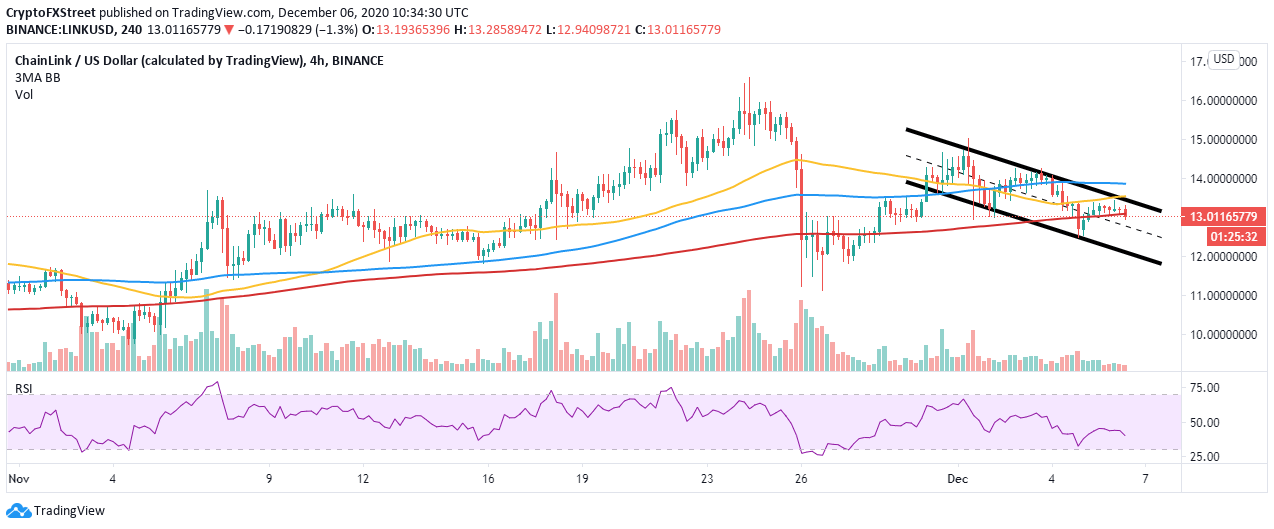
LINK/USD 4-hour chart
The TD Sequential indicator is likely to present a sell signal on the weekly chart in the coming week. The call to sell will come in a green nine candlestick. In July, the previous sell signal saw Chainlink fall massively from $20 to the support at $7.2. If validated, LINK’s impending breakdown might overshoot the support at $11 and dive significantly under $10.
-637428485856880142.png)
LINK/USD weekly chart
The bearish picture would be invalidated on the upside if Chainlink closed the day above the 200 SMA. A break past the channels’ upper boundary will place the decentralized oracle live price feed token to price levels above $16.
Author

John Isige
FXStreet
John Isige is a seasoned cryptocurrency journalist and markets analyst committed to delivering high-quality, actionable insights tailored to traders, investors, and crypto enthusiasts. He enjoys deep dives into emerging Web3 tren


