Chainlink whales go into buying spree while technicals suggest LINK price could drop to $12
- Chainlink price is bounded inside a major ascending parallel channel formed since September 23.
- It is currently trading right in the middle of the pattern which means a breakout will not happen any time soon.
-637336005550289133.jpg)
Unlike most of the top cryptocurrencies, Chainlink established its all-time high in August 2020 at around $20. The digital asset plummeted to $7.4 before recovering and touching $16,39 on November 24.
Chainlink price remains stable but could be on the verge of a big move
On the 4-hour chart, Chainlink has established an ascending parallel channel since September 23 and it’s trading right in the middle of it. The upper trendline is all the way at $17 and the lower boundary at $12.
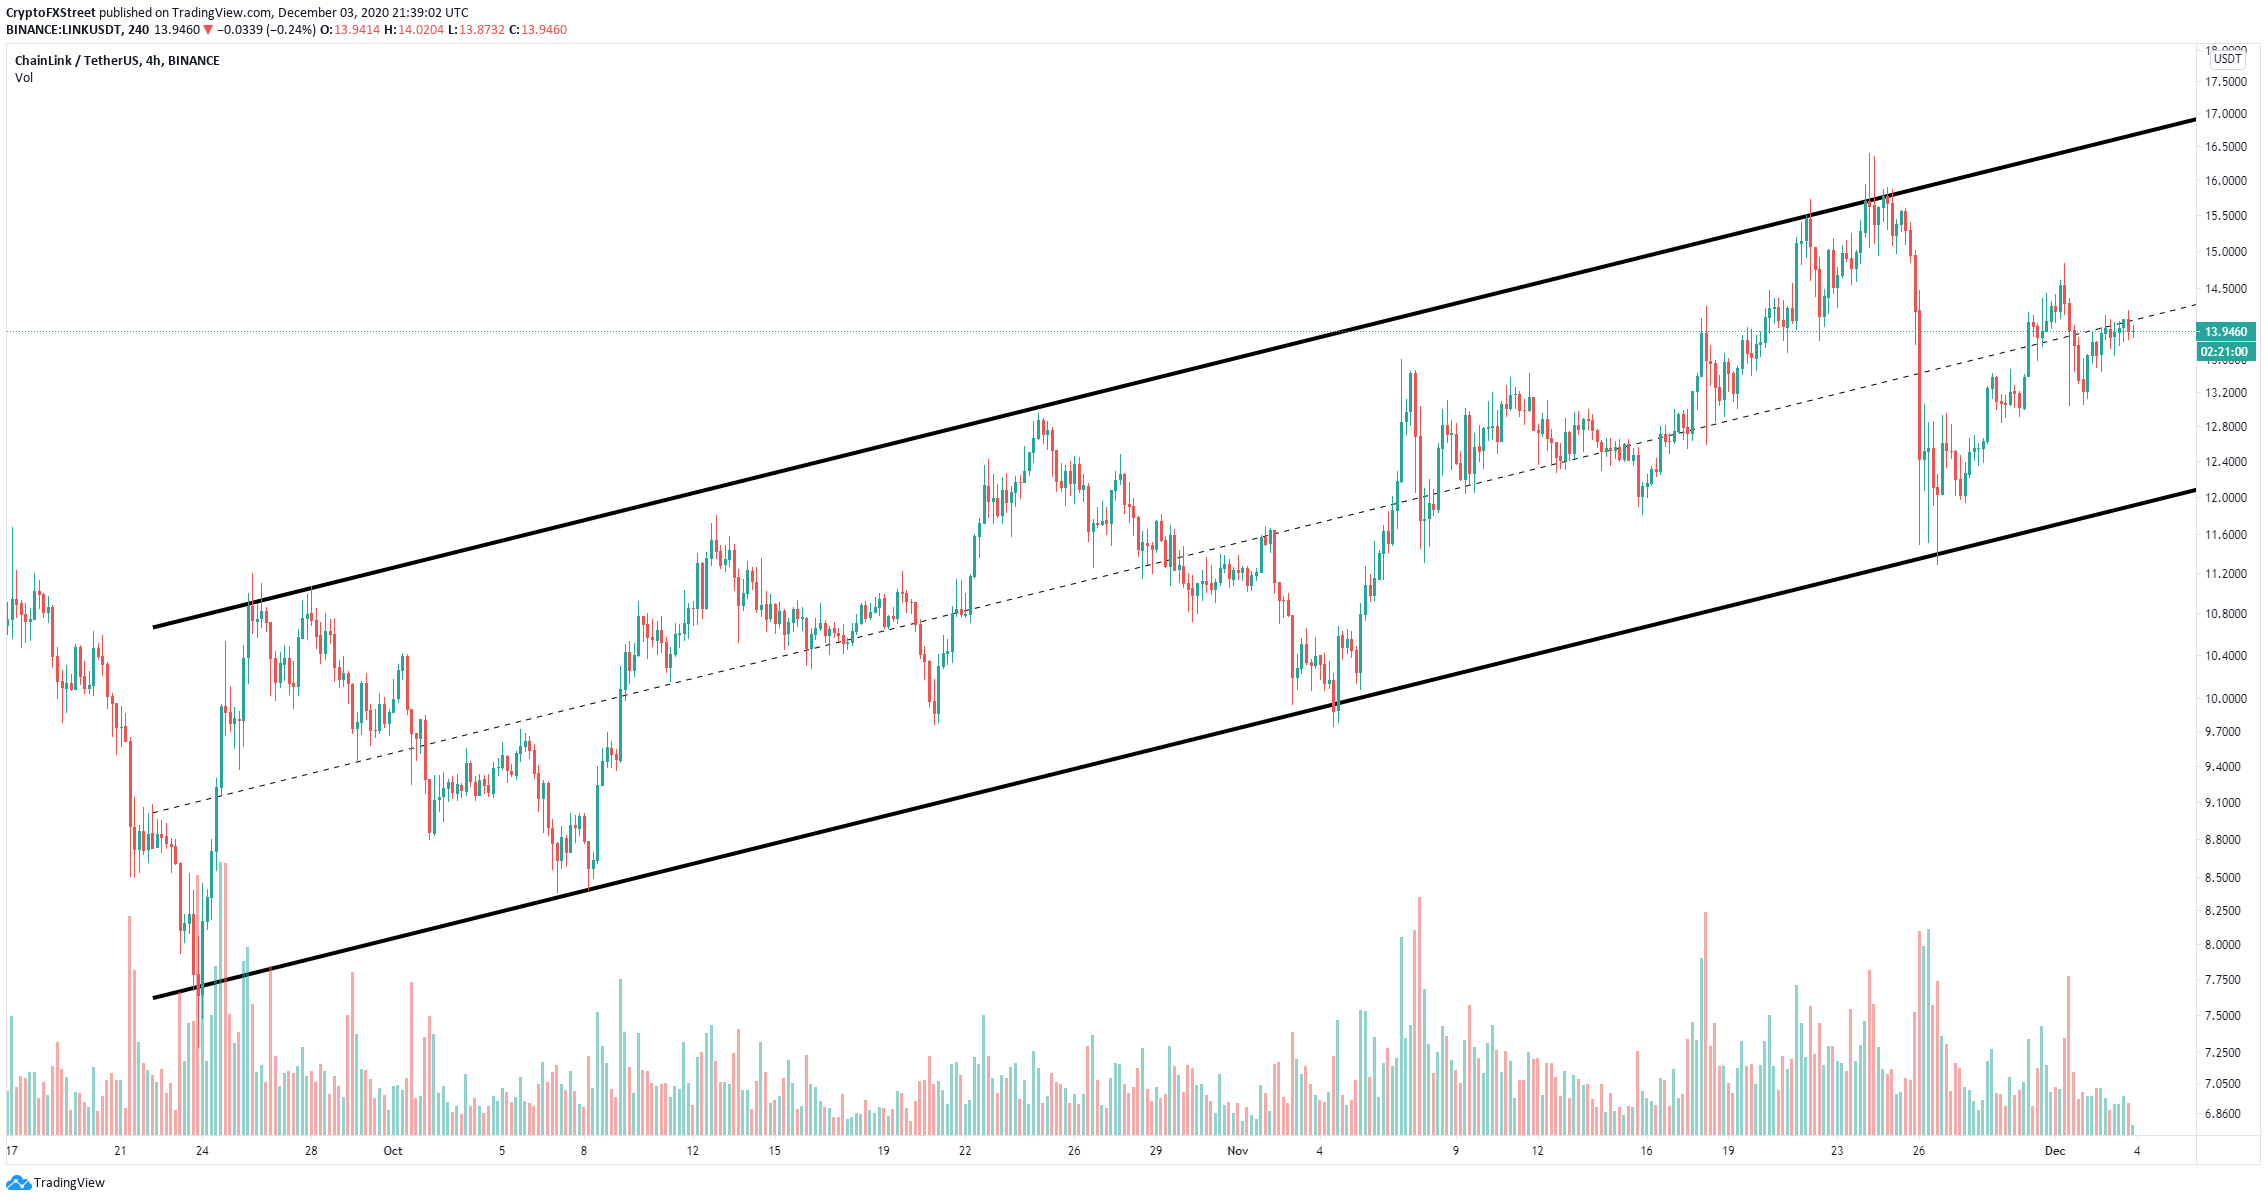
LINK/USD 4-hour chart
The TD Sequential indicator has just presented a sell signal. In the past, these sell signals have been extremely accurate which indicates LINK is on the verge of a breakdown. The 100-SMA is acting as a strong support level. Breaking below this moving average can quickly push Chainlink price towards the 50-SMA at $13.3 and the lower boundary of the parallel channel at $12.
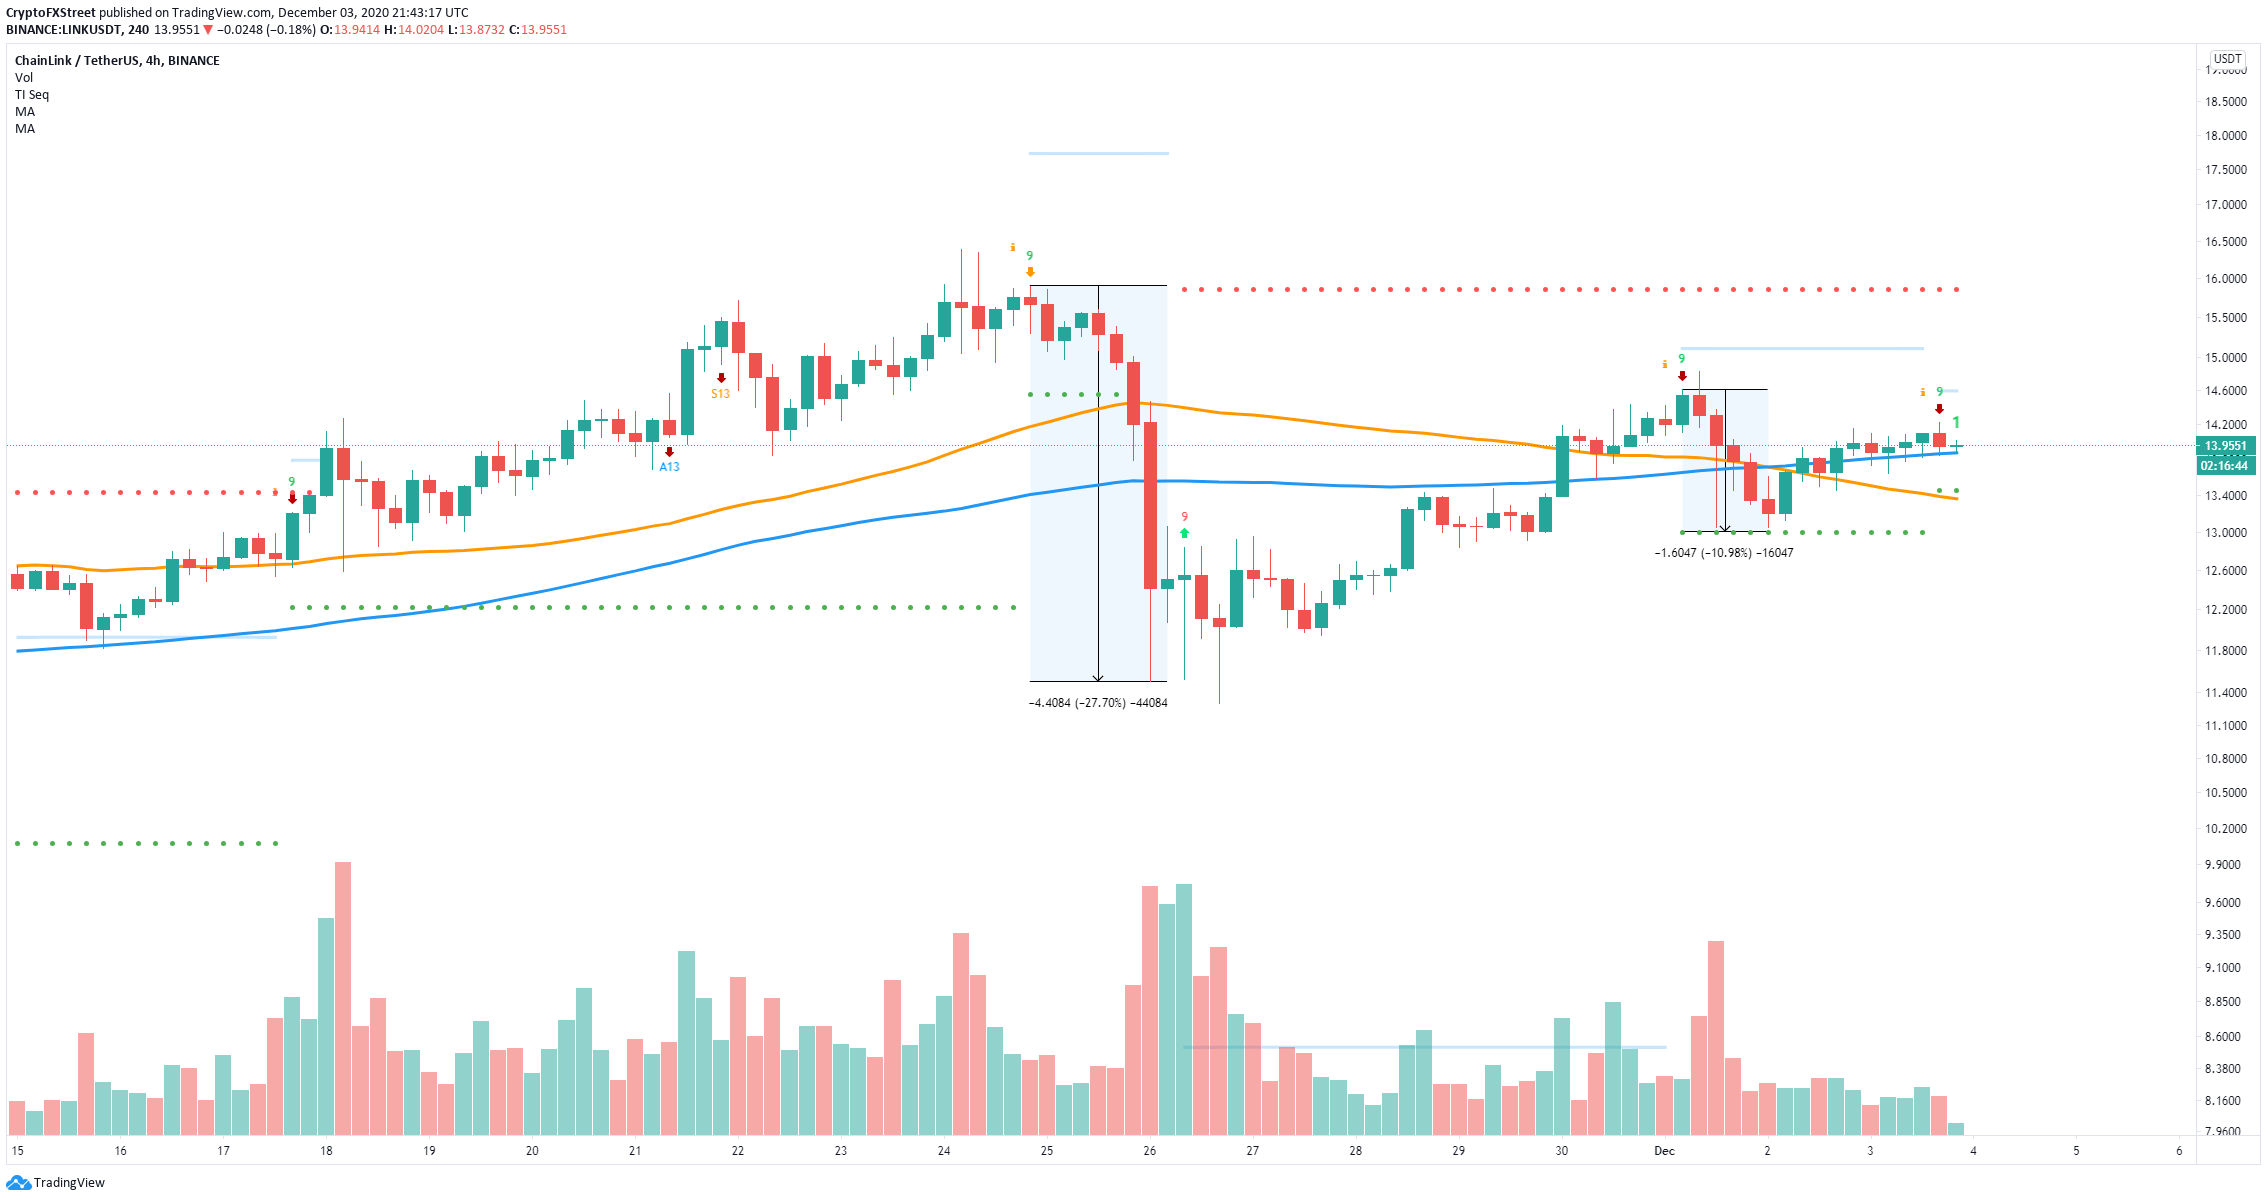
LINK/USD 4-hour chart
On the other hand, according to recent statistics provided by Santiment, it seems that the number of Chainlink whales continues to grow in the past month. This indicates that large investors are still extremely interested in the digital asset despite being having a lower value.
https://t.co/w0E1mpn3fD
— Santiment (@santimentfeed) December 3, 2020
The amount of high-end #Chainlink investors continue to grow, according to our 'Holder Distributions' data. There are 445 more addresses holding 1,000 or more $LINK (currently at least $13,950), compared to last month. The behavior of whale holders pic.twitter.com/0LG5MSRXWl
If the bulls can hold the 100-SMA support on the 4-hour chart, the sell signal would be invalidated and Chainlink price can quickly climb towards the upper boundary of the ascending parallel channel at $17.
Author

Lorenzo Stroe
Independent Analyst
Lorenzo is an experienced Technical Analyst and Content Writer who has been working in the cryptocurrency industry since 2012. He also has a passion for trading.


