Cardano Price Prediction: ADA poised for 22% upswing despite bearish technical picture
- Cardano has formed a falling wedge pattern on the 4-hour chart, hinting at a potential liftoff to $1.4.
- The bullish outlook will gain credibility if the price settles above the 4-hour 200 SMA.
- Consolidation is likely to delay the anticipated upswing based on the IOMAP model.

Cardano's downtrend seems to be coming to an end. Its retreat has been steady since the sellers' rejection at $1.48 (an all-time high). A double-top pattern is likely to have contributed to the incurred losses. Meanwhile, ADA is trading within the confines of a technical pattern, likely to result in a tremendous upswing.
Cardano grinds closer to a technical breakout
Cardano is exchanging hands at the apex of a falling wedge pattern. This pattern is bullish and is created following a significant move in price. Resistance such as the one at $1.48 stops the uptrend, leading to losses. It is worth noting that the losses incurred tend to find higher support and are then succeeded by a period of consolidation.
Once the price cracks the upper trend line resistance, a breakout occurs. An increase in volume adds credence to the bullish outlook. The liftoff has an exact target, measured from the highest to lowest points of the pattern, as illustrated on the chart below.
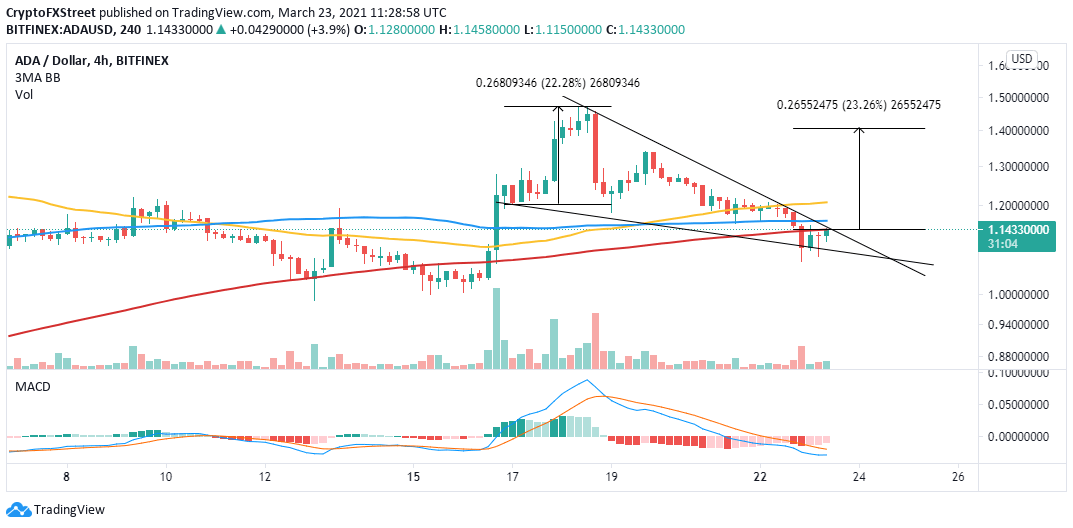
ADA/USD 4-hour chart
Cardano bulls have channeled their attention toward breaking the short-term hurdle at the 200 Simple Moving Average (SMA) on the 4-hour chart. This will add credence to the anticipated breakout from the wedge pattern. On the upside, the upswing eyes gain to $1.4, where it is likely to trigger massive buy orders, placing ADA on the remaining journey to new all-time highs.
Looking at the other side of the picture
The 4-hour Moving Average Convergence Divergence (MACD) indicator has a bearish impulse. The MACD line (blue) still holds under the signal line. Moreover, the indicator has dived into the negative region, implying that bears have more control over the price.
Simultaneously, the IOMAP by IntoTheBlock shows that ADA will probably stick to consolidation, thus delaying the expected liftoff. For instance, immense resistance is forecasted between $1.24 and $1.27. Here, nearly 91,000 addresses had previously purchased 2.15 billion ADA.
-637520992114436091.png)
Cardano IOMAP chart
It is worth mentioning that the IOMAP model reveals Cardano is sitting on top of a robust support area, running from $1.1 to $1.14. Here, roughly 68,600 addresses had previously scooped up approximately 2.5 billion ADA. It is doubtful that the price will crack through this zone in the near-term, thus validating the sideways trading.
Author

John Isige
FXStreet
John Isige is a seasoned cryptocurrency journalist and markets analyst committed to delivering high-quality, actionable insights tailored to traders, investors, and crypto enthusiasts. He enjoys deep dives into emerging Web3 tren



