Cardano Price Forecast: ADA bearish technical pattern risks massive downswing
- Cardano’s majestic rally closes in on the all-time high of $1.48.
- A double-top pattern brings to light potential losses in the near-term.
- The MACD indicator has a bullish impulse, suggesting that bulls are not ready to give up control.

Cardano’s listing on Coinbase Pro early this week was the main catalyst for the massive gains posted. The upcoming smart contract token recovered from the dip marginally under $1.
Several tentative resistance zones did little to stop the gains, allowing the bullish leg to spike close to the recently traded all-time high around $1.48. However, ADA has hit resistance at $1.44, commencing a correction from an extremely bearish pattern.
Cardano prints a double-top pattern
The double-top pattern is extremely bearish and usually results in a colossal correction. This pattern forms when the price tests a similar resistance barrier twice (separated by a tough). Usually, the area hosts many sellers, making it difficult for buyers to slice through.
As for Cardano, the formation of a double-top pattern suggests that a correction is in the cards. Meanwhile, ADA is teetering at $1.39 following a minor correction. If the double-top pattern confirms, we can expect Cardano to drop appreciably, perhaps test the anchors provided by the 100 Simple Moving Average (SMA), the 50 SMA, and the 200 SMA on the 4-hour chart.
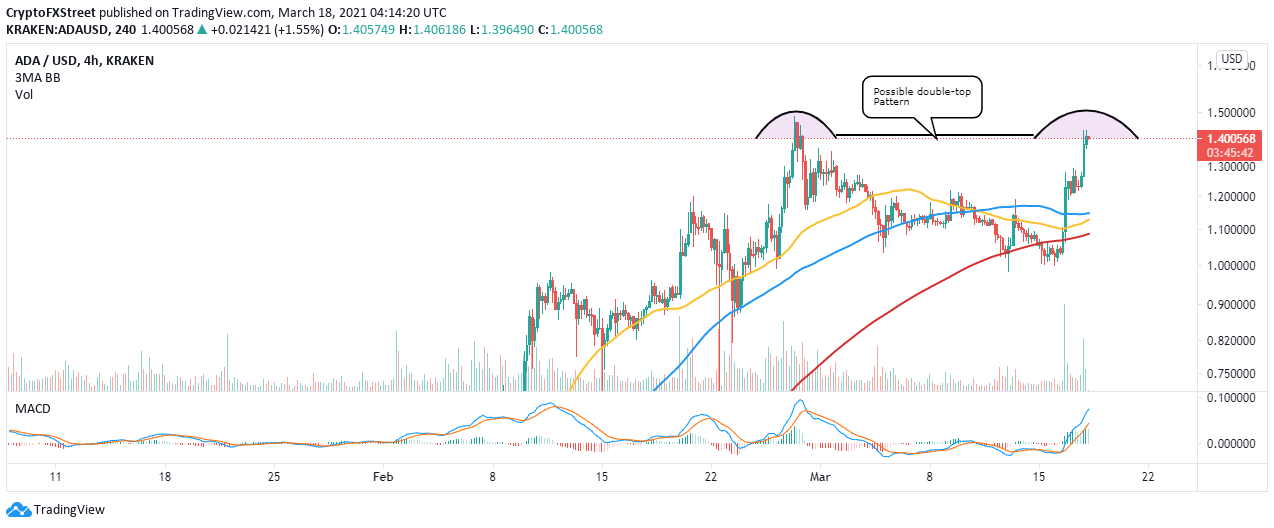
ADA/USD 4-hour chart
Looking at the other side of the picture
The 4-hour SuperTrend indicator has recently sent out a signal to long Cardano. The pattern flipped bullish by changing its color to green and moving under the price. Traders use this indicator to identify instances to long or short an asset. As long as the SuperTrend indicator is under the price, ADA’s general trend would be upward.
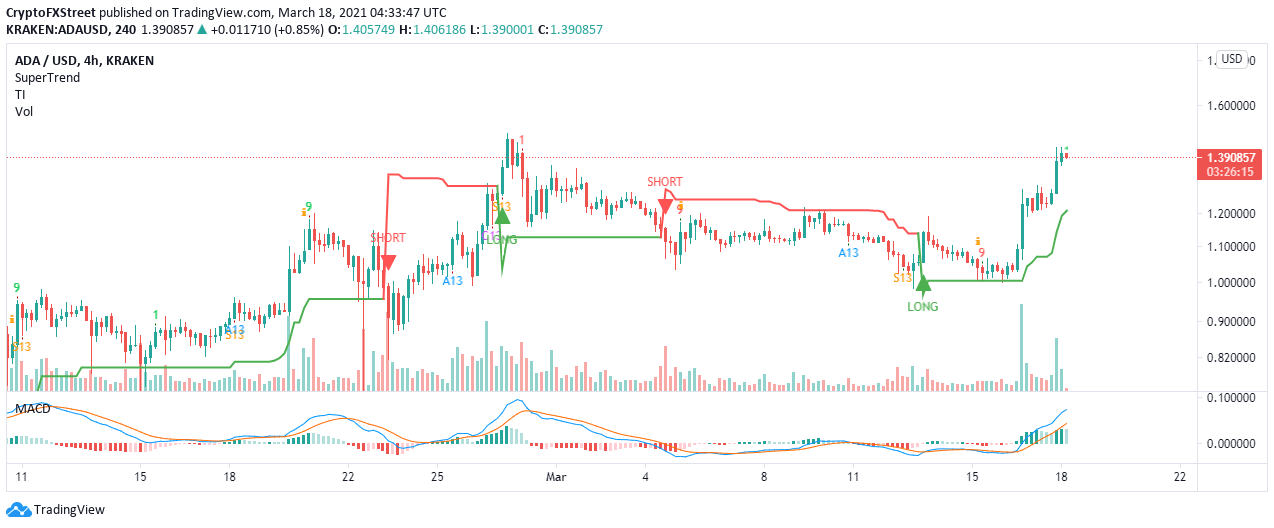
ADA/USD 4-hour chart
The Moving Average Convergence Divergence (MACD) shows that the trend is still in favor of the bulls. Besides moving higher within the positive region, the MACD line (blue) widens the divergence above the signal line.
Author

John Isige
FXStreet
John Isige is a seasoned cryptocurrency journalist and markets analyst committed to delivering high-quality, actionable insights tailored to traders, investors, and crypto enthusiasts. He enjoys deep dives into emerging Web3 tren


