Cardano Price Prediction: ADA eying up a potential bounce, according to technicals
- ADA is currently trading at $0.1069 after a notable 2% spike within 20 minutes.
- Several indicators are showing that ADA could be ready for a rebound in the short-term.

The current market capitalization of Cardano is $3.3 billion, gaining around $500 million in the past week after a significant surge. The digital asset topped out at $0.114 but is showing bullish signs again after a brief and healthy consolidation period.
Cardano showing signs of bullish strength
The digital asset has already confirmed a daily uptrend after establishing a higher low at $0.0893 compared to the last low at $0.0828. ADA also created three higher highs and turned the 50-SMA into a support level on October 9.
ADA/USDT daily chart
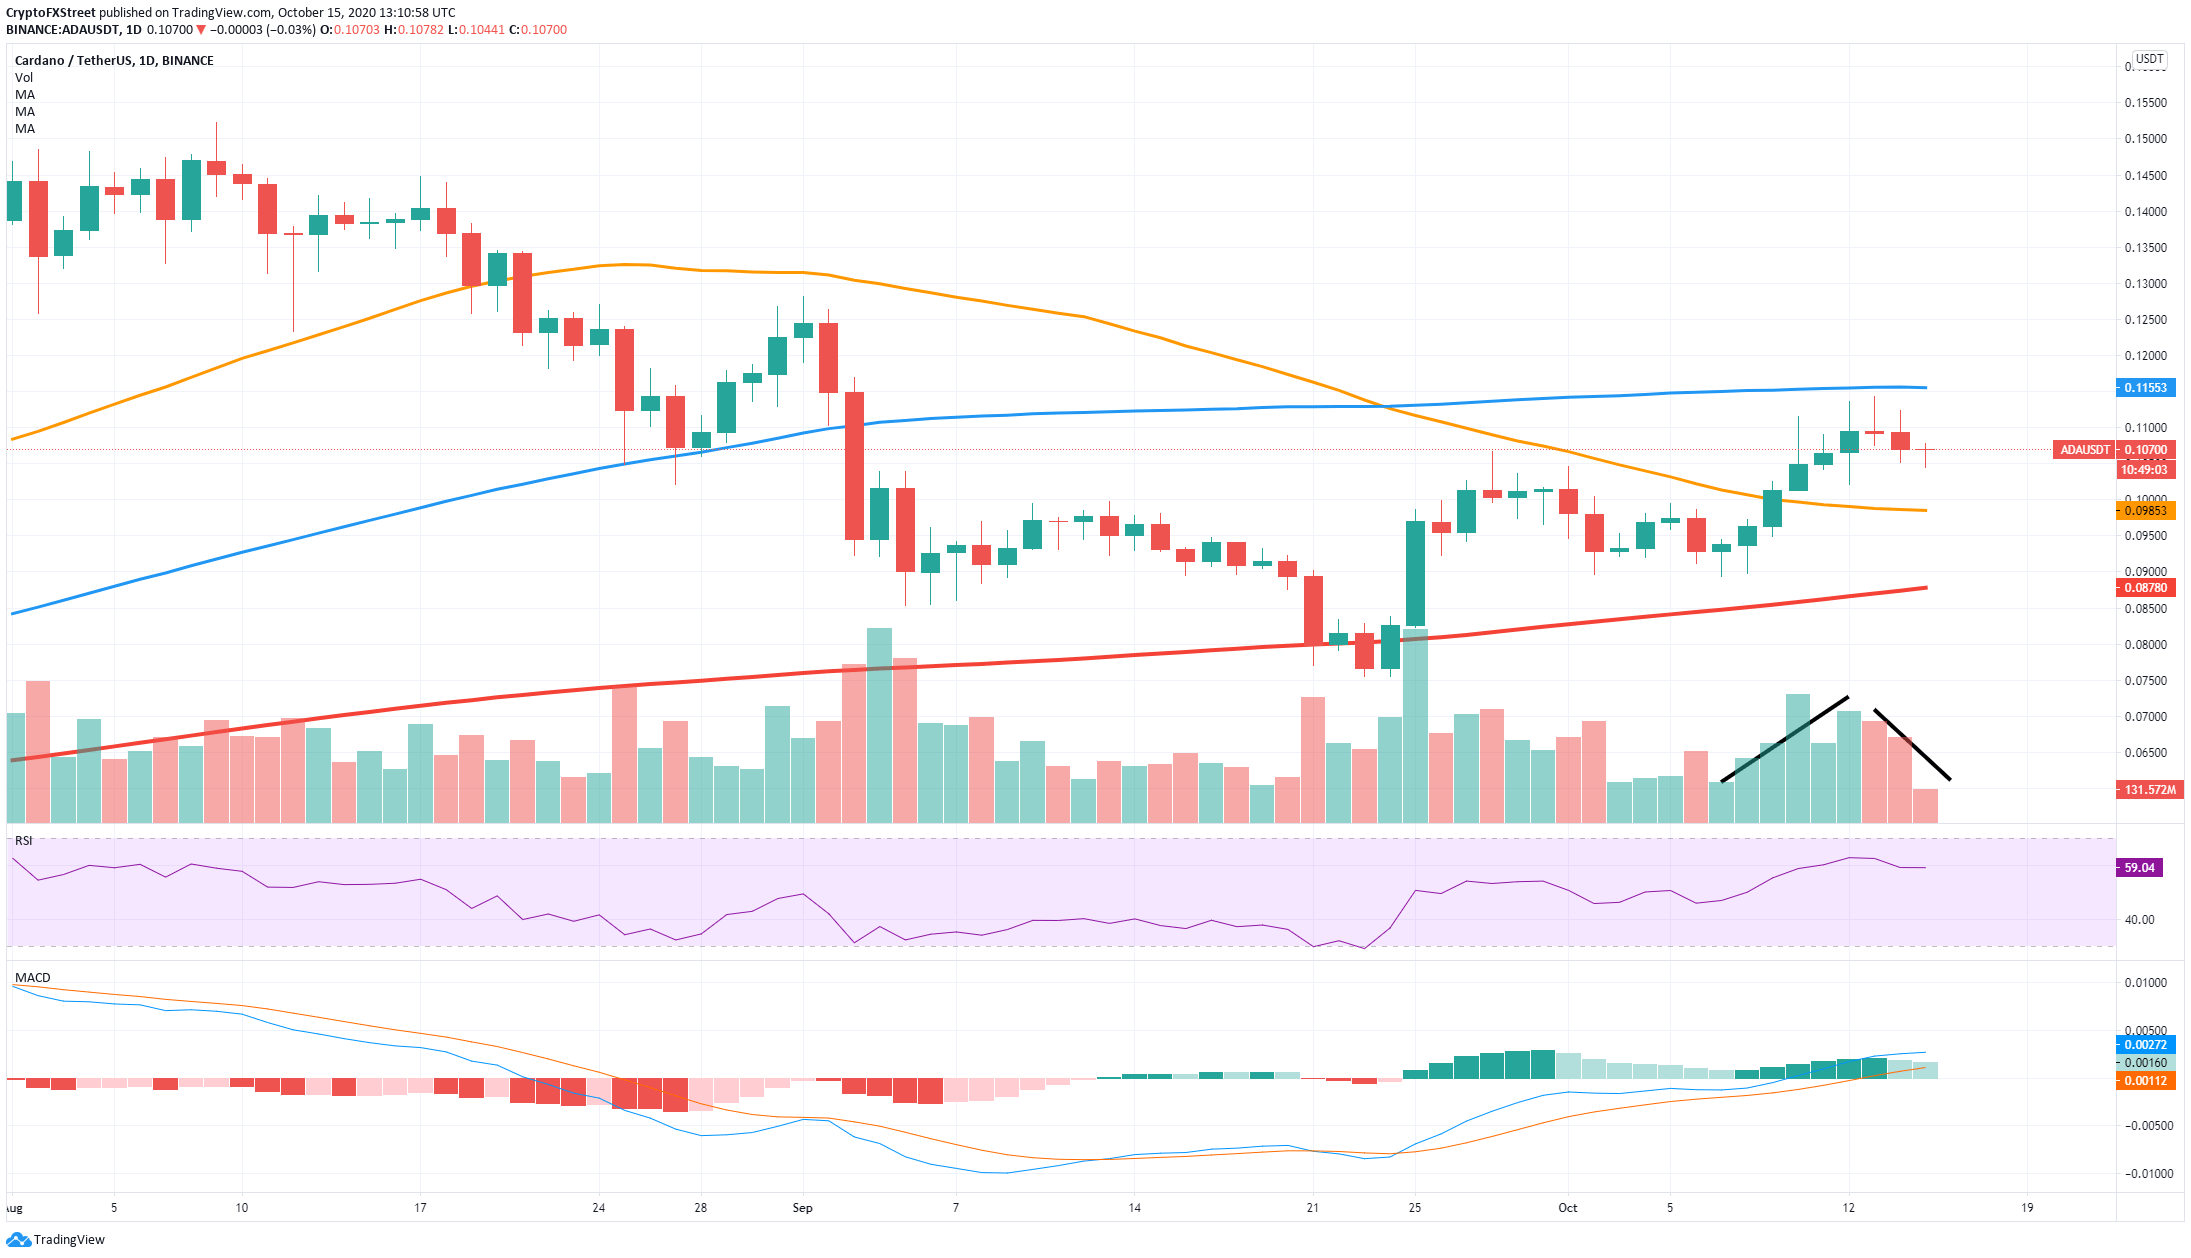
The MACD is bullish since September 25 and continues strengthening. Additionally, the trading volume of Cardano seems to be increasing on Binance on bullish moves while decreasing during the consolidation period. The RSI has cooled off a bit and will not pose a threat to the bulls in the short-term.
ADA/USDT 4-hour chart
-637383649570985861.png)
On the 4-hour chart, the TD sequential indicator has presented a buy signal on October 15 that seems to be getting some follow-through action. Although the MACD is bearish, it is slowly shifting towards a bull cross. It seems that the next resistance level is located at $0.1125.
ADA IOMAP Chart
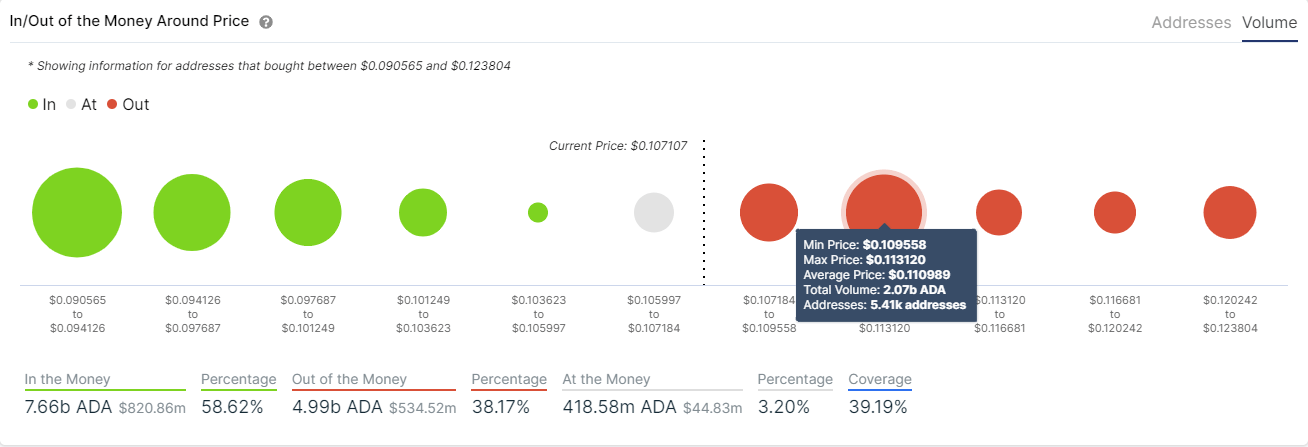
The In/Out of the Money Around Price chart confirms this theory showing a strong resistance area between $0.109 and $0.113 with 2.07 billion ADA in volume. A breakout above this point can push the digital asset up to $0.1238 as there are no other significant resistance levels on the way up.
Some bearish signs for Cardano
On the other hand, not everything is in favor of Cardano. On the daily chart, the TD sequential indicator has presented a green ‘7’ which usually precedes a sell signal within the next few days. The rejection from the 100-SMA at $0.1155 is also a notable bearish sign.
ADA/USDT daily chart

The next support level for ADA would be $0.098 where the 50-SMA is currently located. The IOMAP chart seems to confirm this as it shows practically no support until $0.097. If the bearish momentum continues like this, Cardano could easily fall towards $0.097.
Crucial price levels for Cardano
Despite a rejection from the 100-SMA on the daily chart, Cardano is showing signs of a potential bounce in the short-term. The next target price for the bulls would be $0.1238 if they see a breakout above $0.113, which is the strongest resistance level according to the IOMAP chart.
On the other hand, bears are currently in control and eying up the $0.097 support level where the 50-SMA is located on the daily chart. The IOMAP chart shows almost no support on the way down in comparison to the area at $0.097 and the resistance above.
Author

Lorenzo Stroe
Independent Analyst
Lorenzo is an experienced Technical Analyst and Content Writer who has been working in the cryptocurrency industry since 2012. He also has a passion for trading.


