|

Cardano Price Prediction: ADA could slip to a two-month low if key level cracks

  • Cardano price is contained inside an ascending triangle pattern on the 12-hour chart.
  • ADA has lost a critical support level and could be on the verge of another drop.
  • Bulls must hold the last key support point to avoid another crash.

Cardano has been trading somewhat sideways for the past two months and established a massive resistance trendline around $1.5. The digital asset could be on the brink of a significant leg down if bulls can’t hold key support level.

Cardano momentum shifts in favor of the bears

On the 12-hour chart, Cardano established three tops at around $1.5 and has formed an ascending triangle pattern. The digital asset has also lost the 50 and 100 SMA support levels.

ada price

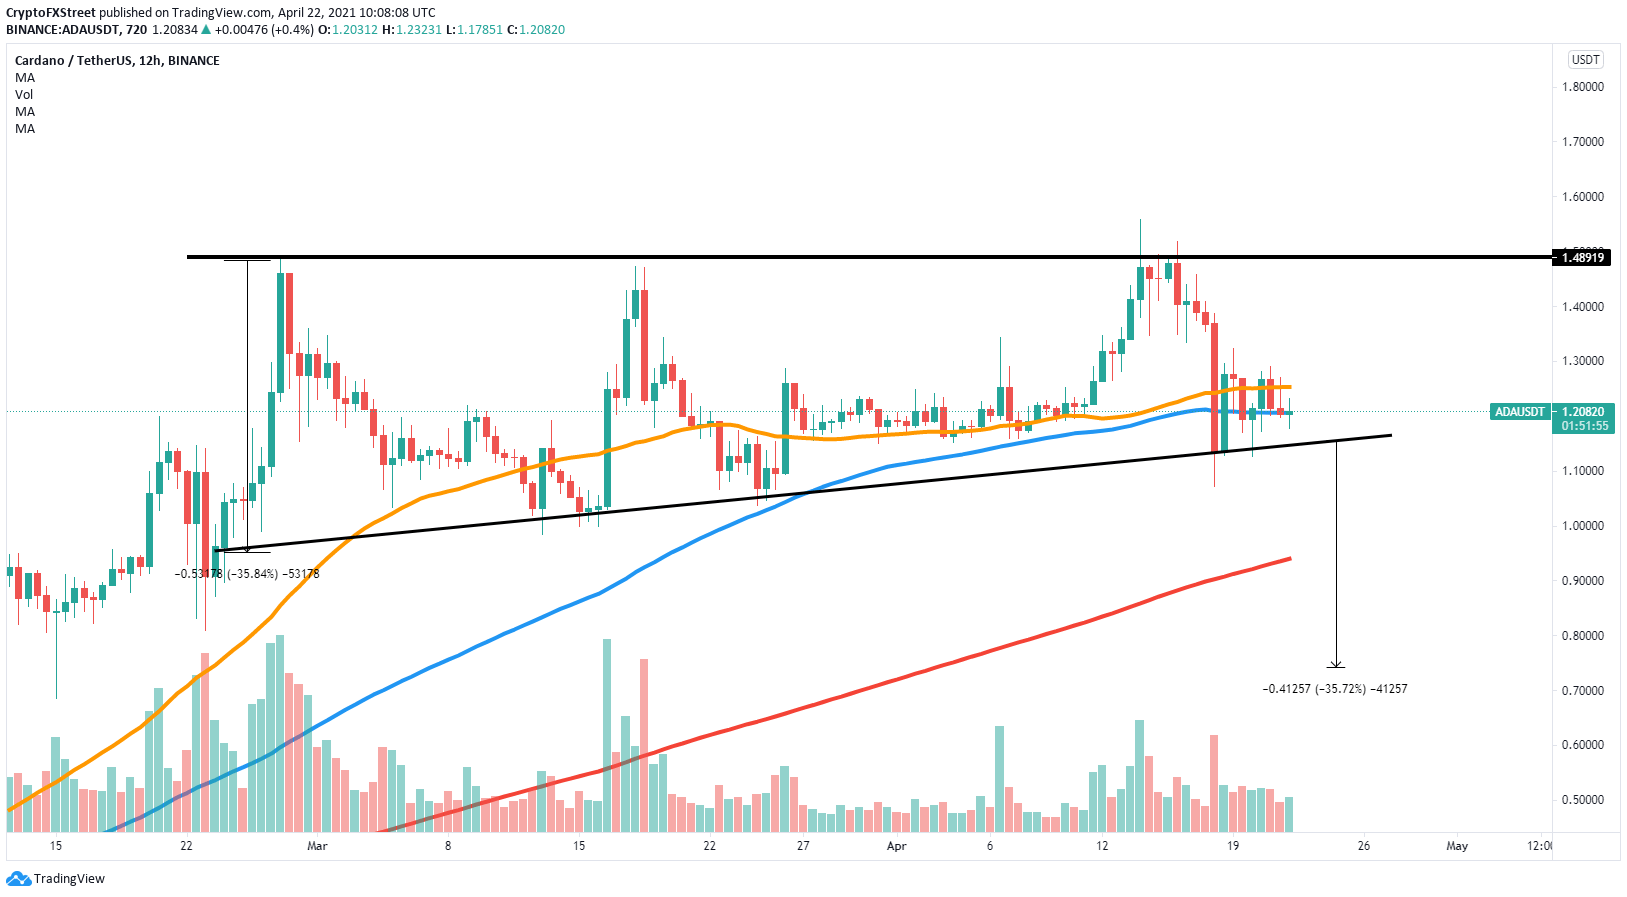
ADA/USD 12-hour chart

The most significant support trend line is located at $1.15. A 12-hour candlestick close below this point would be devastating and could drive ADA toward the 200 SMA at $0.94 and as low as $0.74, a price target calculated using the initial height of the pattern as a reference point

However, if bulls can hold the key support trend line, they could aim for a breakout of a symmetrical triangle pattern formed on the 1-hour chart

ada price

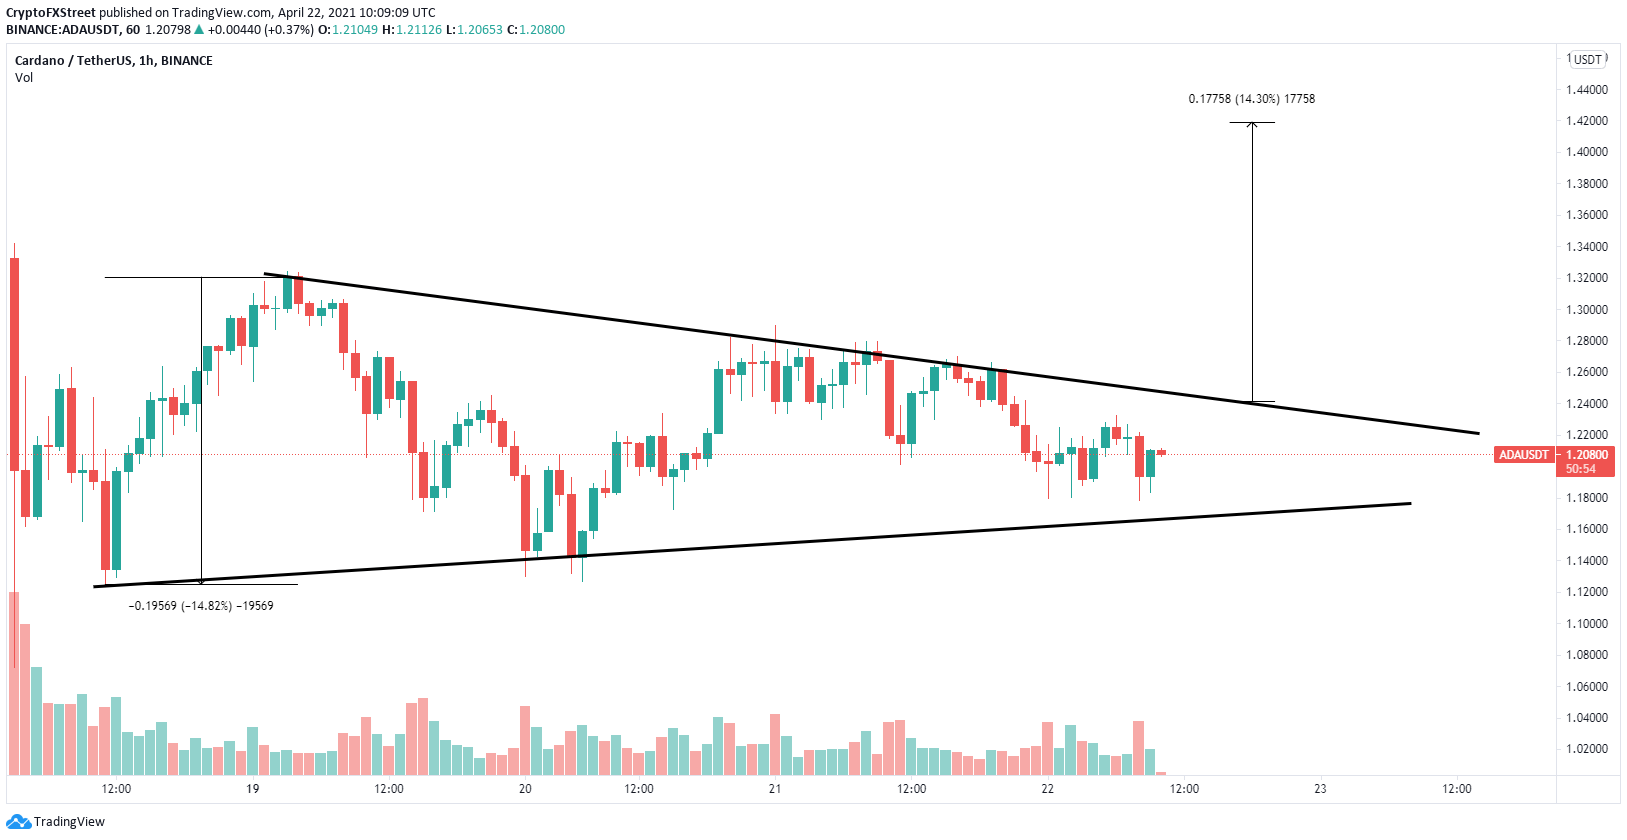
ADA/USD 1-hour chart

The resistance point here is formed at $1.24. A 1-hour candlestick close above this point has a price target of $1.41.

Author

Lorenzo Stroe

Lorenzo Stroe

Independent Analyst

Lorenzo is an experienced Technical Analyst and Content Writer who has been working in the cryptocurrency industry since 2012. He also has a passion for trading.

More from Lorenzo Stroe
Share:

Editor's Picks

Ripple slides as low retail, institutional demand weigh

Ripple edges lower, trading marginally below $1.60 at the time of writing on Tuesday as bulls and bears battle for control. The cross-border remittance token rose to $1.66 on Monday, but profit-taking and risk-off sentiment in the broader crypto market led to the ongoing correction.

Bitcoin recovers slightly amid ETF inflows, Strategy accumulation

Bitcoin price steadies at $78,000 on Tuesday after rising 2.30% the previous day, following last week’s massive correction. US-listed spot ETFs record an inflow of $561.89 million on Monday, while Strategy adds 855 BTC to its reserve.

Crypto Today: Bitcoin, Ethereum, XRP recovery stalls amid mixed ETF flows

Bitcoin holds above $78,000 but struggles to extend its recovery amid ETF inflows. Ethereum trades under pressure below the $2,300 immediate hurdle, undermined by weakening technical structure.

Monero Price Forecast: XMR extends decline amid persistent bearish outlook

Monero remains under intense selling pressure for the third consecutive week, recording a 4% loss at press time on Tuesday. This is consistent with the declining retail interest in privacy coins, which was among the lowest-performing segments over the last week.

Bitcoin Price Annual Forecast: BTC holds long-term bullish structure heading into 2026

Bitcoin (BTC) is wrapping up 2025 as one of its most eventful years, defined by unprecedented institutional participation, major regulatory developments, and extreme price volatility.

Bitcoin: BTC correction deepens as Fed stance, US-Iran risks, mining disruptions weigh

Bitcoin (BTC) price extends correction, trading below $82,000 after sliding more than 5% so far this week. The bearish price action in BTC was fueled by fading institutional demand, as evidenced by spot Exchange-Traded Funds (ETFs), which recorded $978 million in inflows through Thursday.