Cardano Price Forecast: ADA on-chain metrics reveal paradigm shift in nature of investors
- Cardano price has breached the hypotenuse of an ascending triangle, hinting at a bearish outlook.
- The MRI indicator has flashed a buy signal, but on-chain data suggests that long-term holders are fleeing.
- A breach of the crucial demand zone ranging from $1.02 to $1.10 will trigger a steep correction to subsequent support barriers.

Cardano price shows the loss of momentum from the buyers’ end, which has resulted in a breakdown of a critical support level. Now, a continuation of this momentum could ensue as blockchain data reveals a grim future for ADA.
Cardano price at the edge of a cliff
Cardano price broke out of an ascending triangle after nearly three months. The recent market-wide sell-off that pushed it out of this pattern has dispersed buyers and prevented a recovery.
ADA has shown an invalidation at the retest of the hypotenuse, suggesting a weakness in buying pressure. While the overall outlook is bearish, the Momentum Reversal Indicator has flashed a green ‘one’ candlestick on the 12-hour chart. This trend reversal setup forecasts a one-to-four candlestick upswing.
While this technical indicator suggests an optimistic scenario, investors need to consider the possibility of the downtrend extending into a crucial area that stretches from $1.02 to $1.10. Cardano price could eye $0.99 and $0.92 if the sellers breach the zone mentioned above.
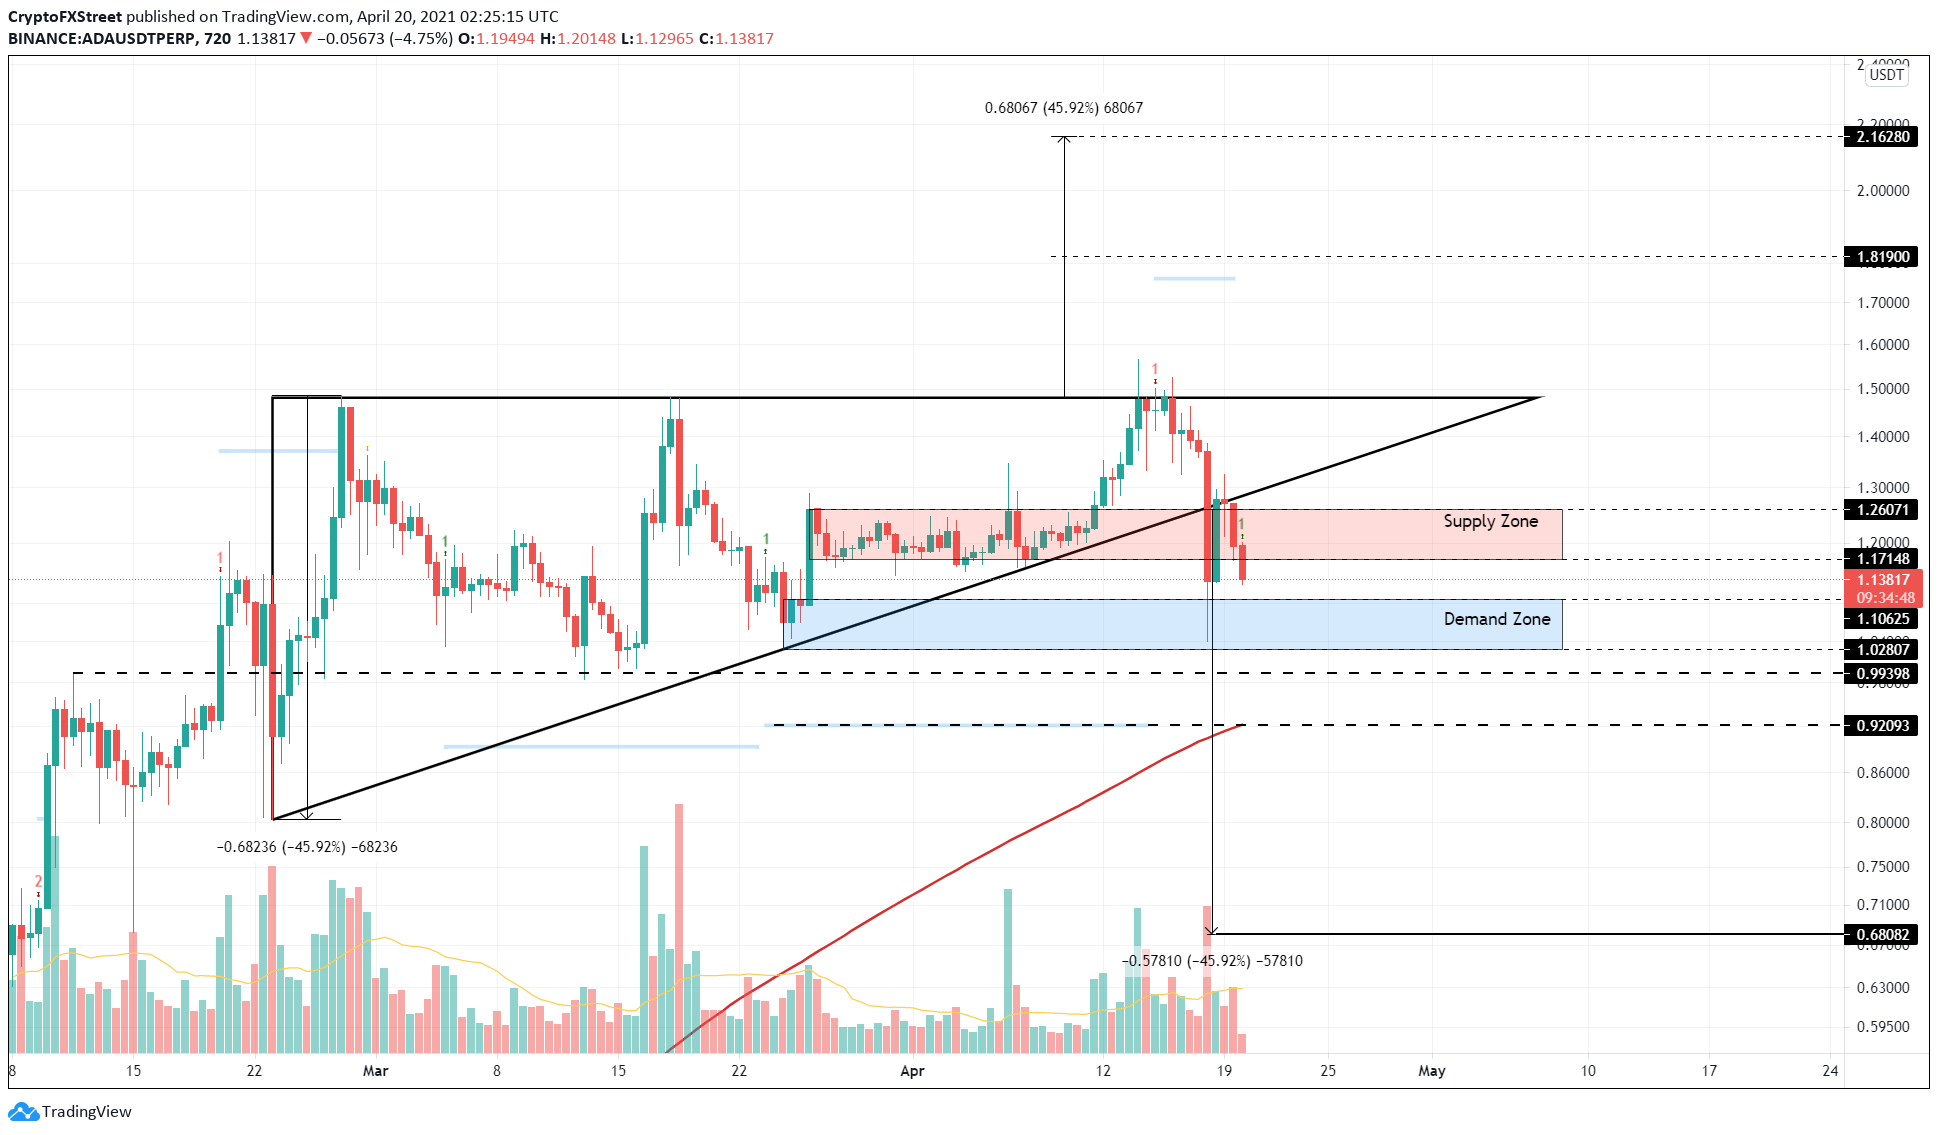
ADA/USDT 12-hour chart
Adding credence to this bearish outlook is the vastness of the underwater investors portrayed by IntoTheBlock’s In/Out of the Money Around Price (IOMAP) model.
These levels contain roughly 470,000 addresses that purchased nearly $10 billion ADA between $1.20 to $1.45.
Therefore, a short-term surge in buying pressure will face selling pressure from investors who might want to break even.
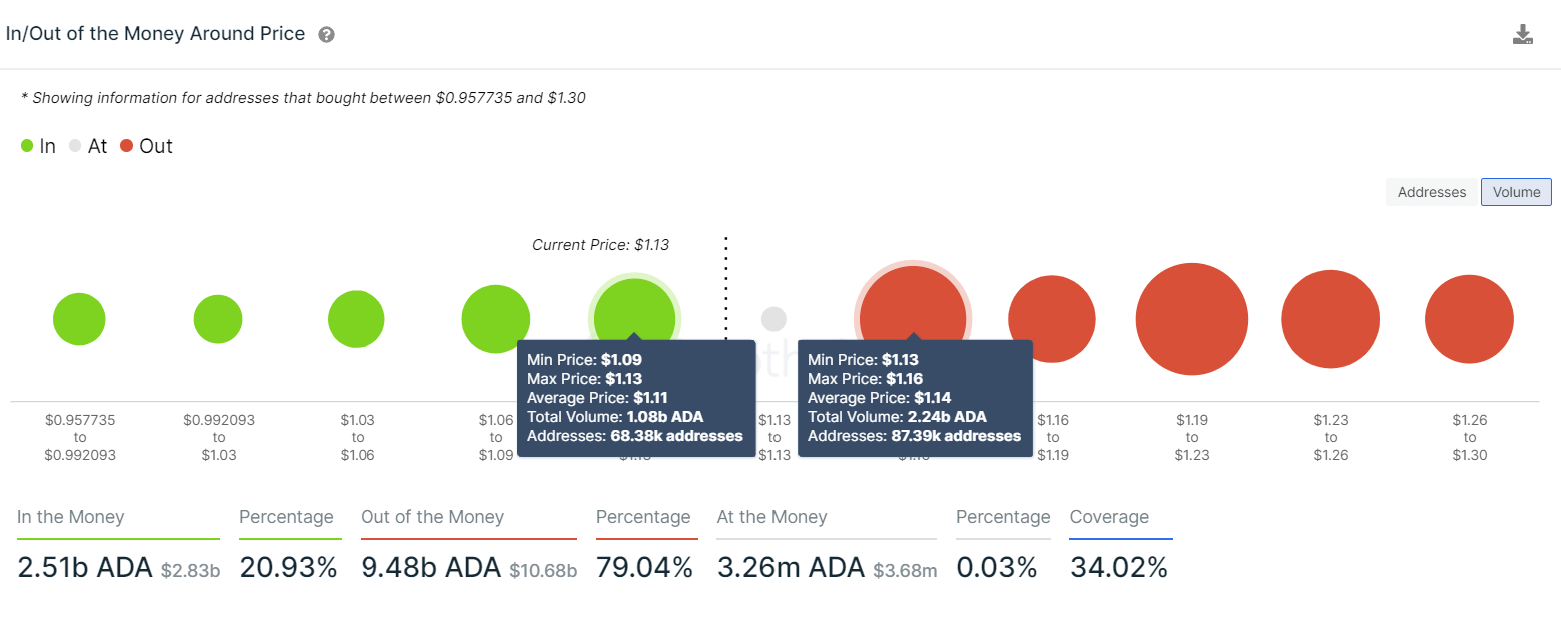
ADA IOMAP chart
The Cardano price’s failed recovery might be due to the long-term holders booking profits. Investors that have held ADA for more than one year have dropped from 197,000 addresses in April 2020 to 162,000 addresses in April 2021. This 17% reduction suggests that such market participants are booking profits.
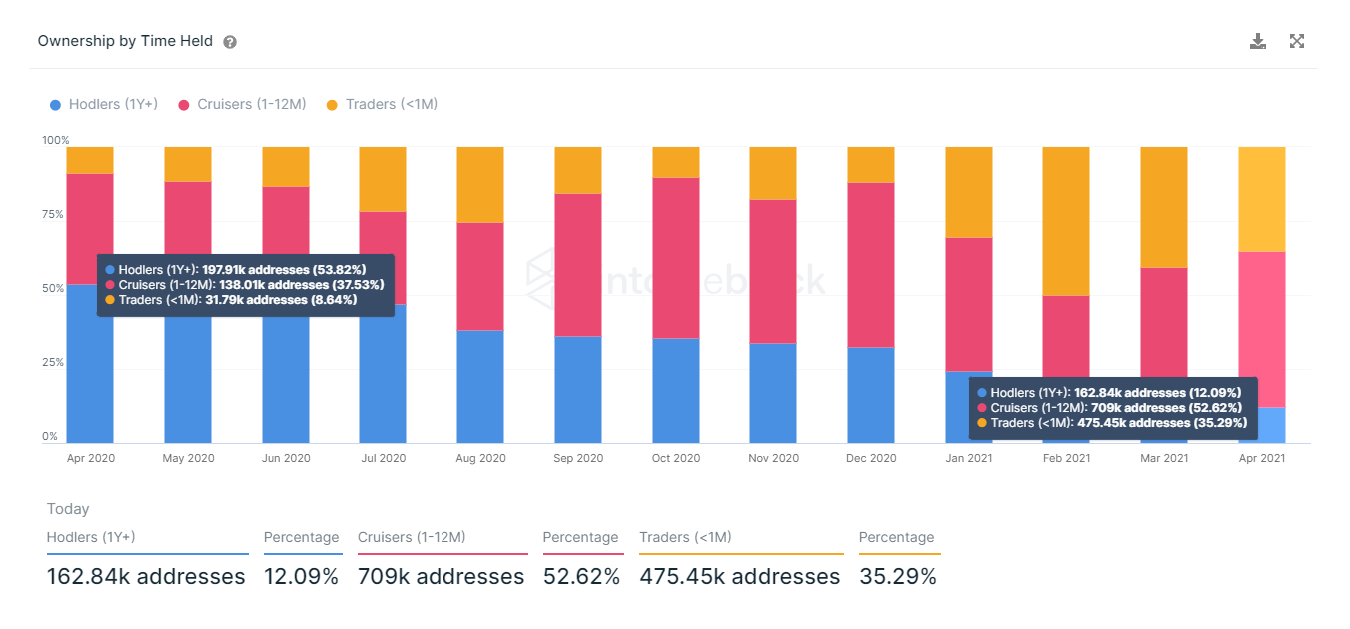
ADA holders chart
The last three months have noticed an 11,400% increase in “all-time highers,” users who purchased ADA within 20% of its all-time high. Contrasting this is a 19% slump in “all-time lowers,” buyers who scooped up ADA within 20% of its all-time low price.
Both the holder metrics suggest that there is a paradigm shift in ADA investors, i.e., long-term whales are booking profits or reallocating their funds while short-term market participants who recently acquired ADA are “Out of the Money.”
Hence, despite the technicals flashing a buy signal on a lower time frame, it is likely that this downtrend will continue due to the migration of tokens from strong hands to weak hands.
Moreover, the sudden drop in Cardano price during the weekend has worsened this situation.
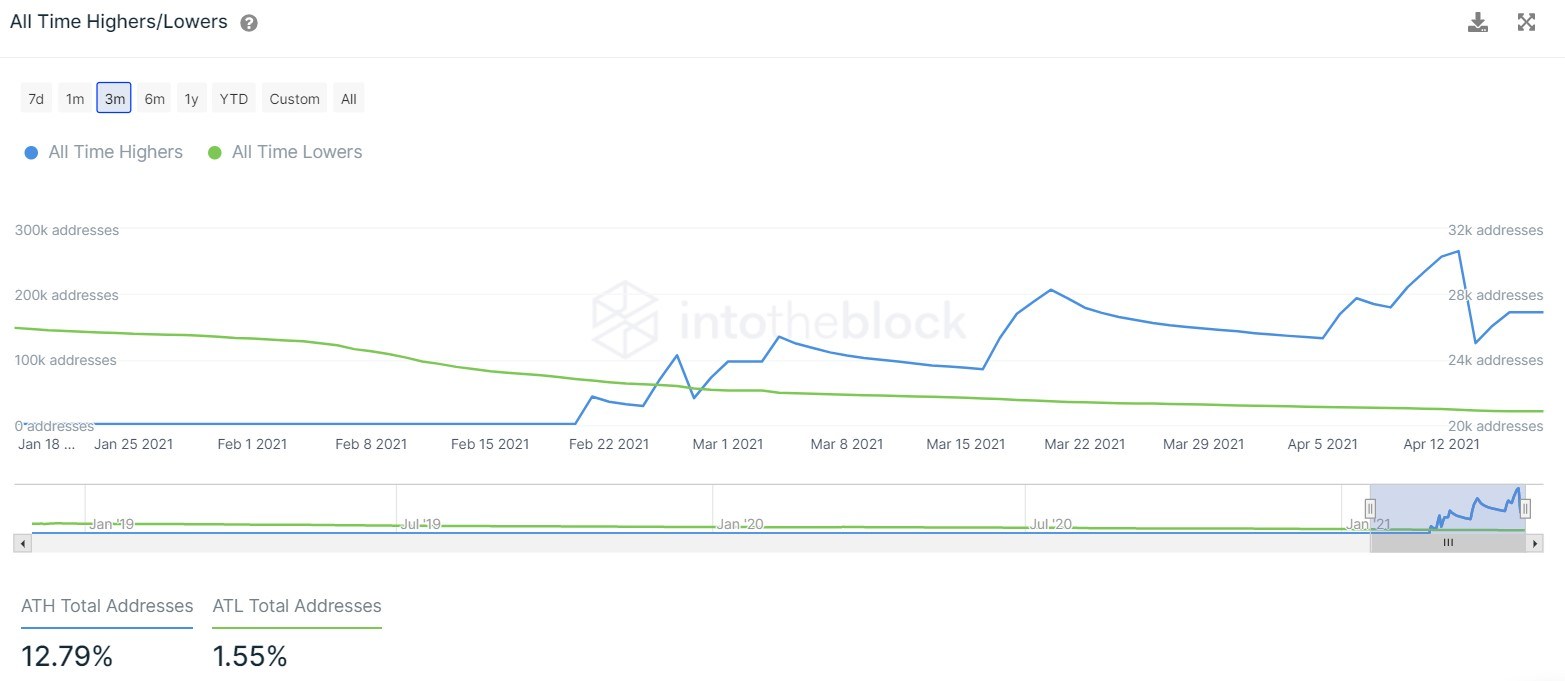
ADA all-time highers/lowers chart
On the flip side, a FOMO-induced rally might disregard this bearish outlook and induce a surge in Cardano’s market value.
If this upswing breaches the supply zone extending from $1.17 to $1.26 and produces a decisive close above $1.35, it will invalidate the bearish outlook and signal the start of a bullish one.
In such a case, a subsequent close above $1.48 will add to ADA’s bullishness.
Author

Akash Girimath
FXStreet
Akash Girimath is a Mechanical Engineer interested in the chaos of the financial markets. Trying to make sense of this convoluted yet fascinating space, he switched his engineering job to become a crypto reporter and analyst.