Cardano Price Analysis: ADA bulls in control, but the bears are waiting around the corner
- ADA currently faces resistance at the 100-day SMA before touching $0.12.
- Cardano’s 3-day chart shows that the price is on the verge of flashing the sell signal.

Between September 2 and September 23, the price of ADA dropped from $0.125 to $0.76. Following that, ADA bounced up from a healthy support line and jumped to $0.11, as of writing. The "Ethereum killer" is presently consolidating between 50-day SMA and 100-day SMA. The MACD shows positive bullish momentum, so further upward movement can be expected.
ADA/USD daily chart
-637387463567267095.png)
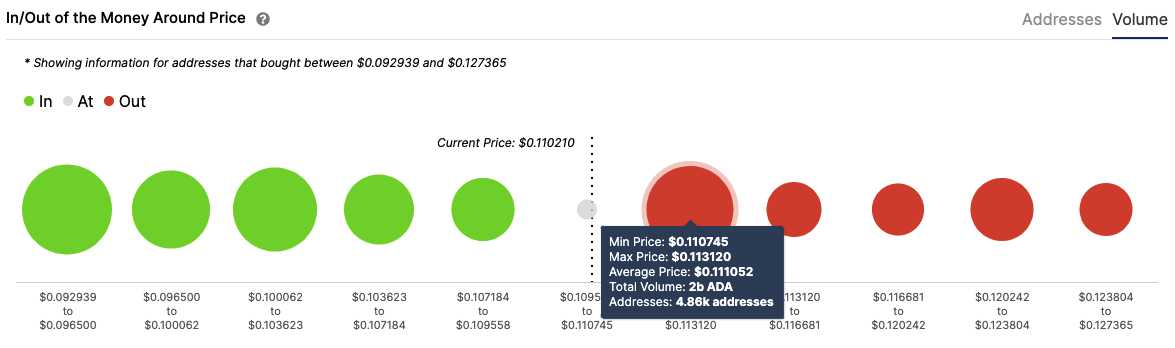
However, before we get carried away, it should be noted that the price had previously faced rejection at the 100-day SMA ($0.114). As per IntoTheBlock’s In/Out of the Money Around Price (IOMAP), the 100-day SMA corresponds with a strong resistance wall, wherein a little over 4,750 addresses had purchased 2 billion ADA. If the buyers manage to break above this barrier, the price should reach $0.12 before it encounters another moderate resistance level.
ADA IOMAP
The Flipside: An upcoming bearish correction?
According to the 3-day chart, the Cardano will be flashing the sell signal (green 9) in the TD sequential indicator after one day. As such, a downtrend could be expected when that signal gets flashed. However, the price has found support on the 50-bar SMA, which is an obstacle for the bears.
ADA/USD 3-day chart
-637387464302201826.png)
To get a better understanding of the price movement, let’s refer to the IOMAP once again. It looks like there are two support walls at $0.101 and $0.94. These two support zones should be robust enough to absorb any selling pressure.
Key price levels to watch
The buyers will need to flip the 100-day SMA ($0.114) from resistance to support to venture into the $0.12 zone. That’s when the price will encounter another moderate resistance barrier. Breaking past that will take the price up to $0.13.
On the downside, the bears will need to deal with two support levels at $0.101 and $0.94. Breaking past the latter will take the price down to the 200-day SMA ($0.89).
Author

Rajarshi Mitra
Independent Analyst
Rajarshi entered the blockchain space in 2016. He is a blockchain researcher who has worked for Blockgeeks and has done research work for several ICOs. He gets regularly invited to give talks on the blockchain technology and cryptocurrencies.


