Cardano Price Analysis: ADA at threshold for a 71% move to $2
- Cardano is on the brink of a massive technical breakout after a period of consolidation.
- The short-term analysis shows that ADA is in the hands of the bulls based on the MACD.
- Selling pressure is likely to increase if the 50 SMA resistance holds, sabotaging the anticipated upswing.

Cardano has ignored widespread bearish calls and is setting the framework for a colossal breakout. The formation of a technical pattern on the 4-hour chart confirms the impending breakout. ADA is trading at $1.12 while bulls battle the hurdle highlighted by the 50 Simple Moving Average.
Cardano is on the verge of a symmetrical triangle breakout
Cardano has printed a symmetrical triangle on the 4-hour chart. The pattern has no bullish or bearish bias and is created by two converging trendlines. An upper trendline connects a series of lower highs while the other links ascending lows. These lines usually meet at a roughly equal point.
The triangle also signifies a period of consolidation before a breakout breakdown. A breakout occurs when the price jumps above the upper trendline. Triangles are known to have exact targets measured from the pattern’s highest to lowest points.
Cardano is getting ready for a massive liftoff to new record highs around $2. Meanwhile, the resistance at the 50 SMA must come down to pave the way for the potential upswing.
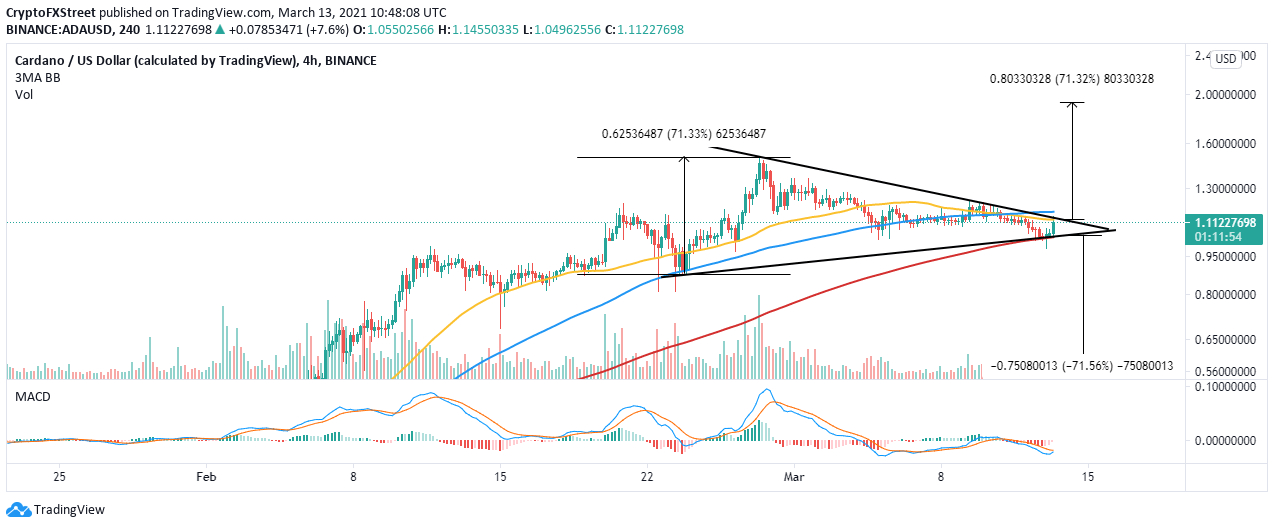
ADA/USD 4-hour chart
The Moving Average Convergence Divergence (MACD) has turned bullish after sending bearish signals for over two weeks. The MACD line (blue) cross above the signal line validates the call to buy. Moreover, recovery into the positive region (above the mean line) will cement the bulls’ position in the market.
Looking at the other side of the fence
It is essential to realize that a symmetrical triangle can also lead to massive losses if the price breaks below the lower trendline. If the 50 SMA resistance remains unshaken, selling pressure may rise, leading to a correction. On the downside, support is highlighted at $0.8, but Cardano will explore the levels downstream by more than 70% if this zone fails to hold.
Author

John Isige
FXStreet
John Isige is a seasoned cryptocurrency journalist and markets analyst committed to delivering high-quality, actionable insights tailored to traders, investors, and crypto enthusiasts. He enjoys deep dives into emerging Web3 tren


