Cardano hidden reversal gives ADA longs early buy opportunity before $2
- Cardano price converts into a bull market on its Point and Figure chart.
- Price action charts lead time-based charts, giving significant leading advantages to price action traders.
- Substantial rise towards the $2.00 value area up ahead.

Cardano price recently broke out above the bear-market angle on its $0.02/3-box reversal Point and Figure chart. That move has resulted in Cardano converting to a bull market.
Cardano price shows bulls now in control, but many participants are still waiting for confirmation
Cardano price action has shifted into a condition that can significantly advantage traders utilizing a price action chart versus a time-based chart like Japanese candlesticks. For example, on the $0.02/3-box reversal Point and Figure chart, Cardano recently converted into a bull market by breaking the prior bear market trend line (red diagonal line).
Traders who use Japanese candlestick charts exclusively are likely to enter their long trades on Cardano price too early and near the top of a swing. In Point and Figure Analysis, a pullback after converting from a bull market to a bear market (and vice versa) is often immediate. A theoretical trade setup can now occur knowing that the pullback is likely.
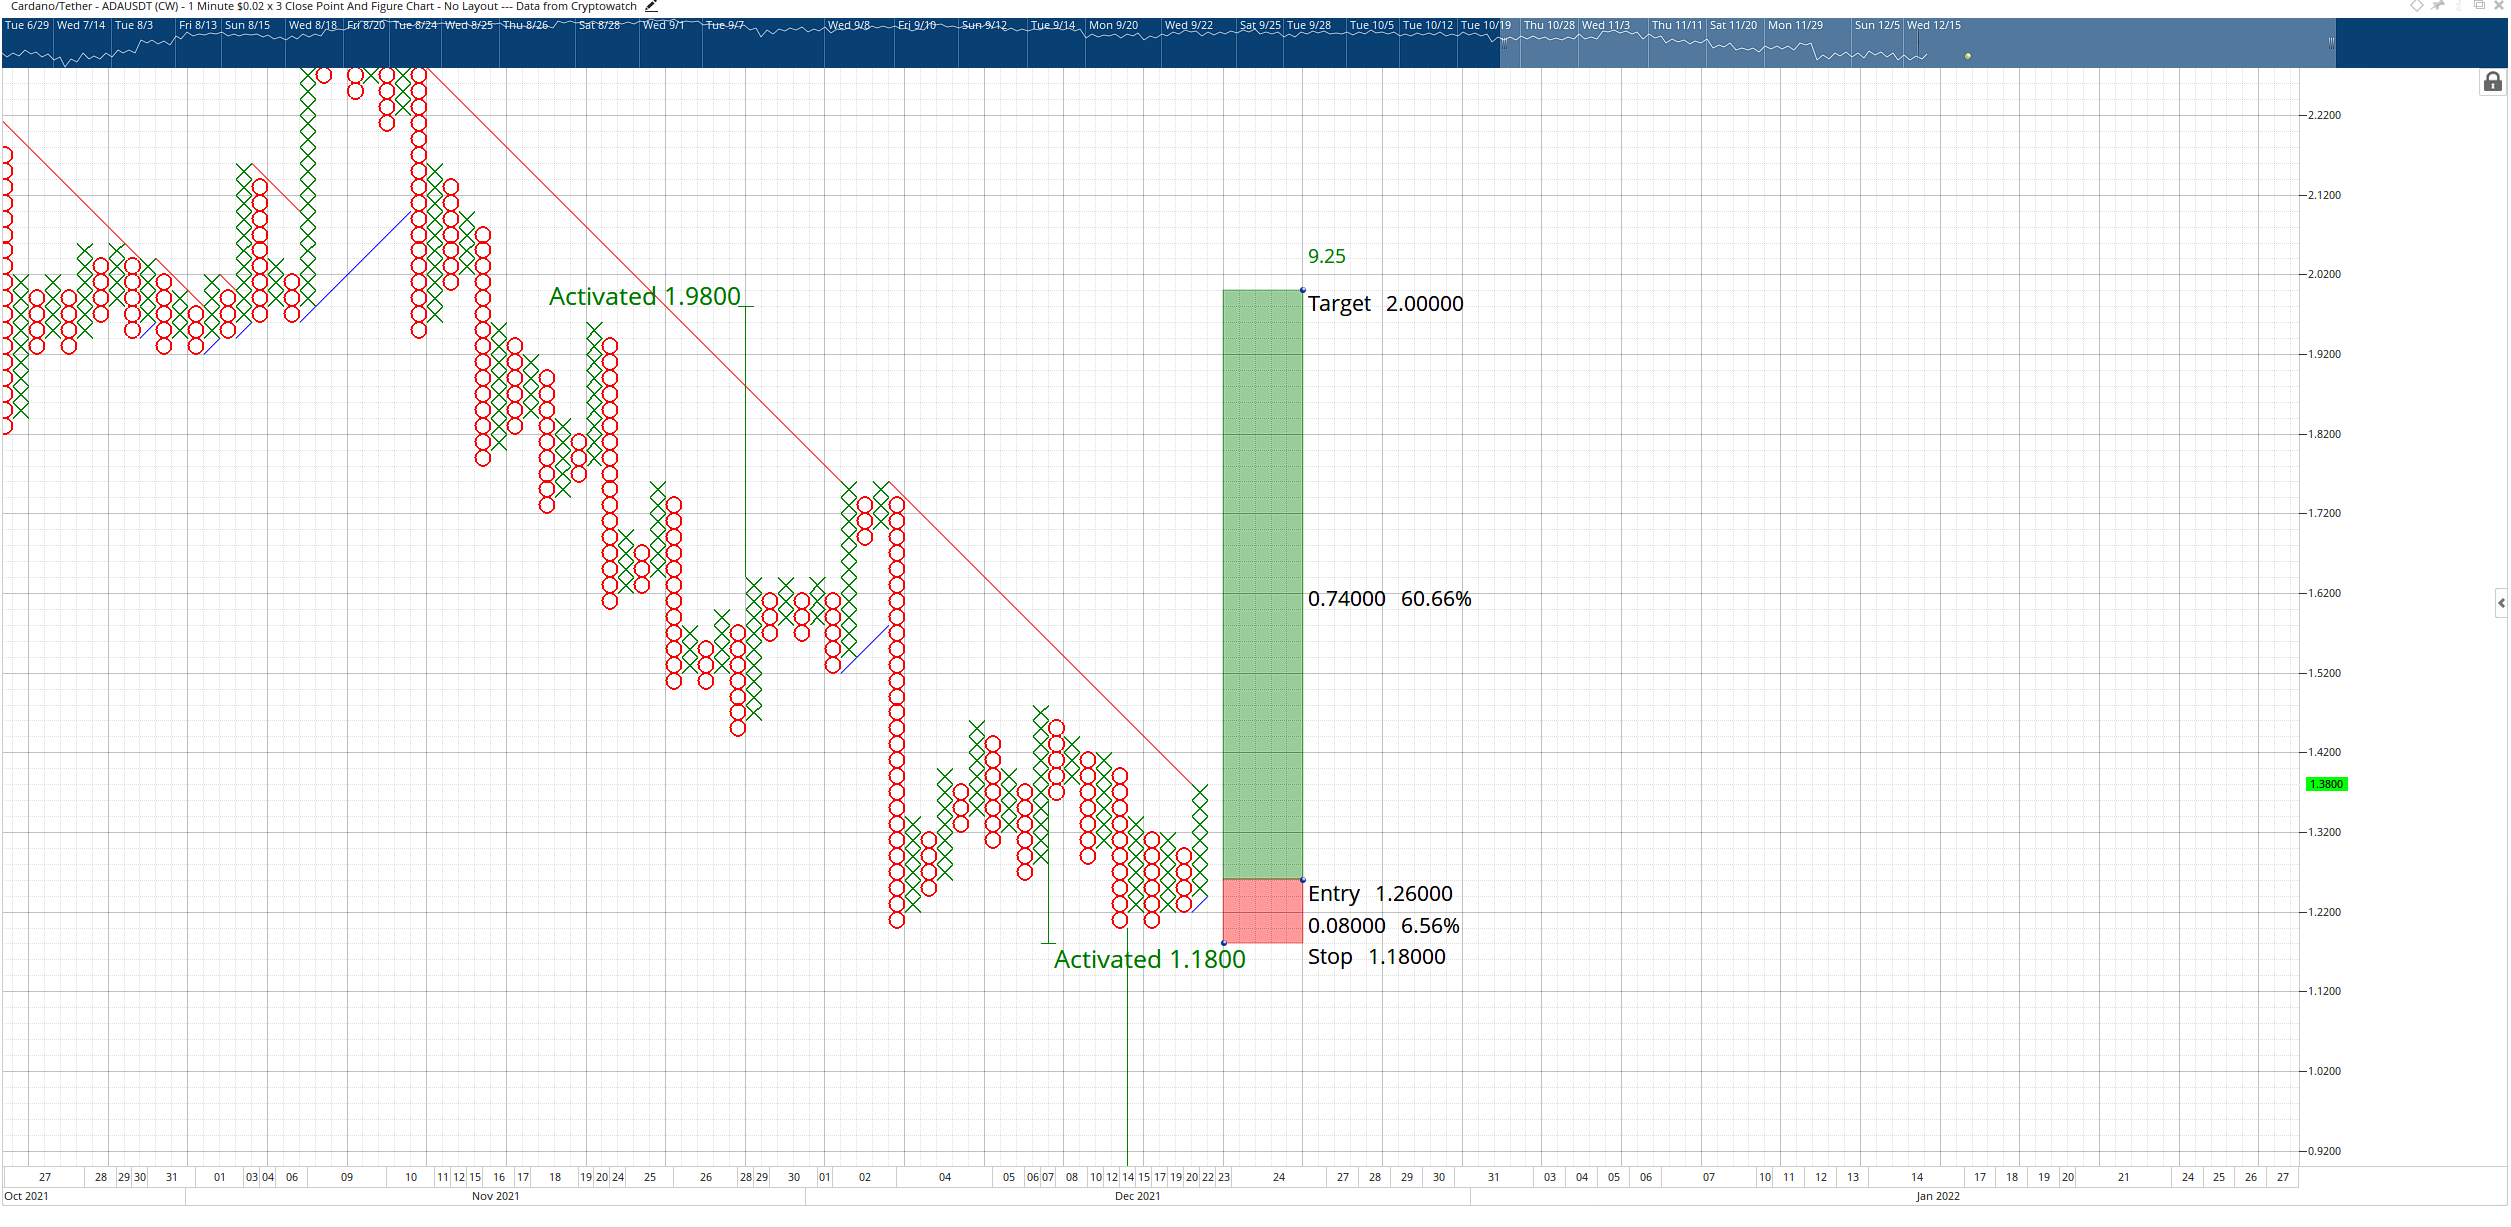
ADA/USD $0.02/3-box Reversal Point and Figure Chart
The theoretical long trade for Cardano price is a buy limit order between $1.32 and $1.26, a stop loss at $1.18, and a profit target at $2.00. This trade is between a 4.86:1 and 9.25:1 reward for the risk depending on the entry. A three-box trailing stop would help protect against any implied profit post entry.
The trade is invalidated if Cardano has a close at or below the $1.18 value area. In that scenario, the $1.00 level becomes tenuous and could fail. Cardano could reach as low as $0.40 in that scenario.
Author

Jonathan Morgan
Independent Analyst
Jonathan has been working as an Independent future, forex, and cryptocurrency trader and analyst for 8 years. He also has been writing for the past 5 years.




