- Cardano price could trap a number of short-sellers anticipating a major price collapse.
- Extremely oversold on the weekly chart with historical lows in some oscillators.
- Downside risks remain the most likely to occur.
Cardano price continues to trade lower but has trade opportunities on both sides of the market. A breakdown below the current support level may only yield a short-term price collapse before a massive rally begins.
Cardano price faces a major uphill battle but is better positioned than most for a surprise rally
Cardano price has a possible long entry on its weekly chart. The theoretical long entry is a buy stop at $1.33, a stop loss at $1.20, and a profit target at $3.00. Cardano must close at or slightly above the $1.33 entry level for the entry to be valid.
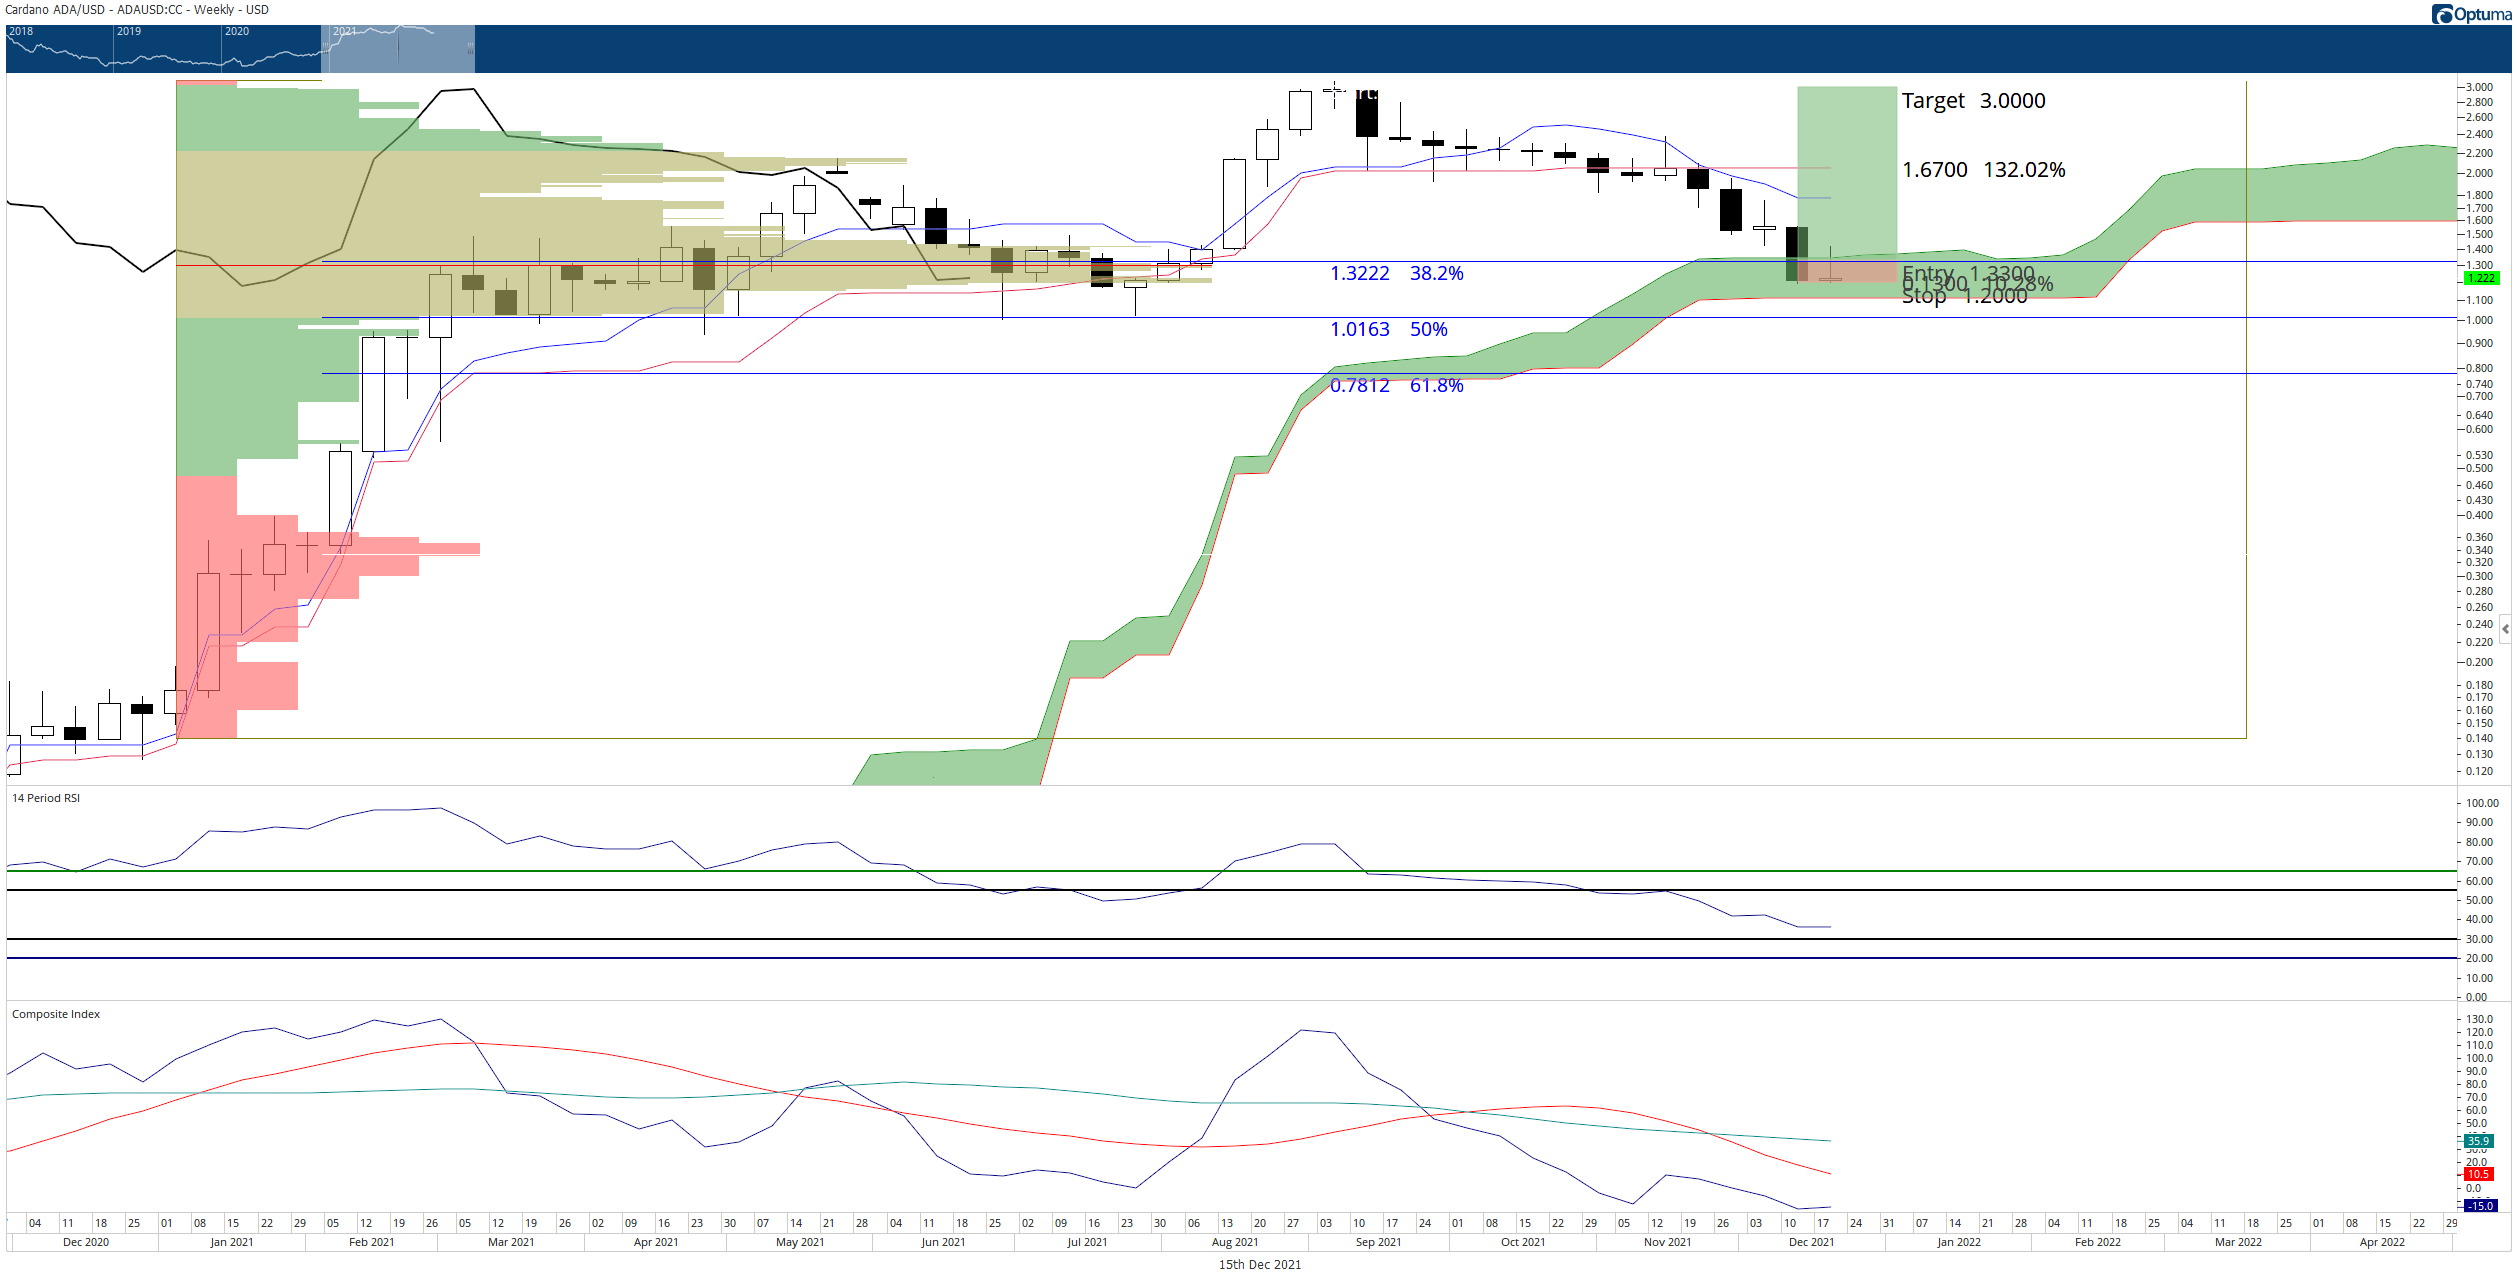
ADA/USD Weekly Ichimoku Chart
If the entry level triggers, it would be a very significant bullish event because that would position Cardano price above the 38.2 Fibonacci retracement, the top of the Cloud (Senkou Span A), and the 2021 Volume Point Of Control. Factors contributing to this theoretical long entry are the Relative Strength Index (RSI) near the first oversold level at 30 and the Composite Index at historical lows.
On the short side of the market, Cardano price has a hypothetical entry on its daily chart with a sell stop order at $1.19, a stop loss at $1.25, and a profit target at $1.00. The entry can only occur if there is a daily close at or slightly below the $1.19 price level. The short entry is based primarily on the head-and-shoulders pattern present on the Composite Index.
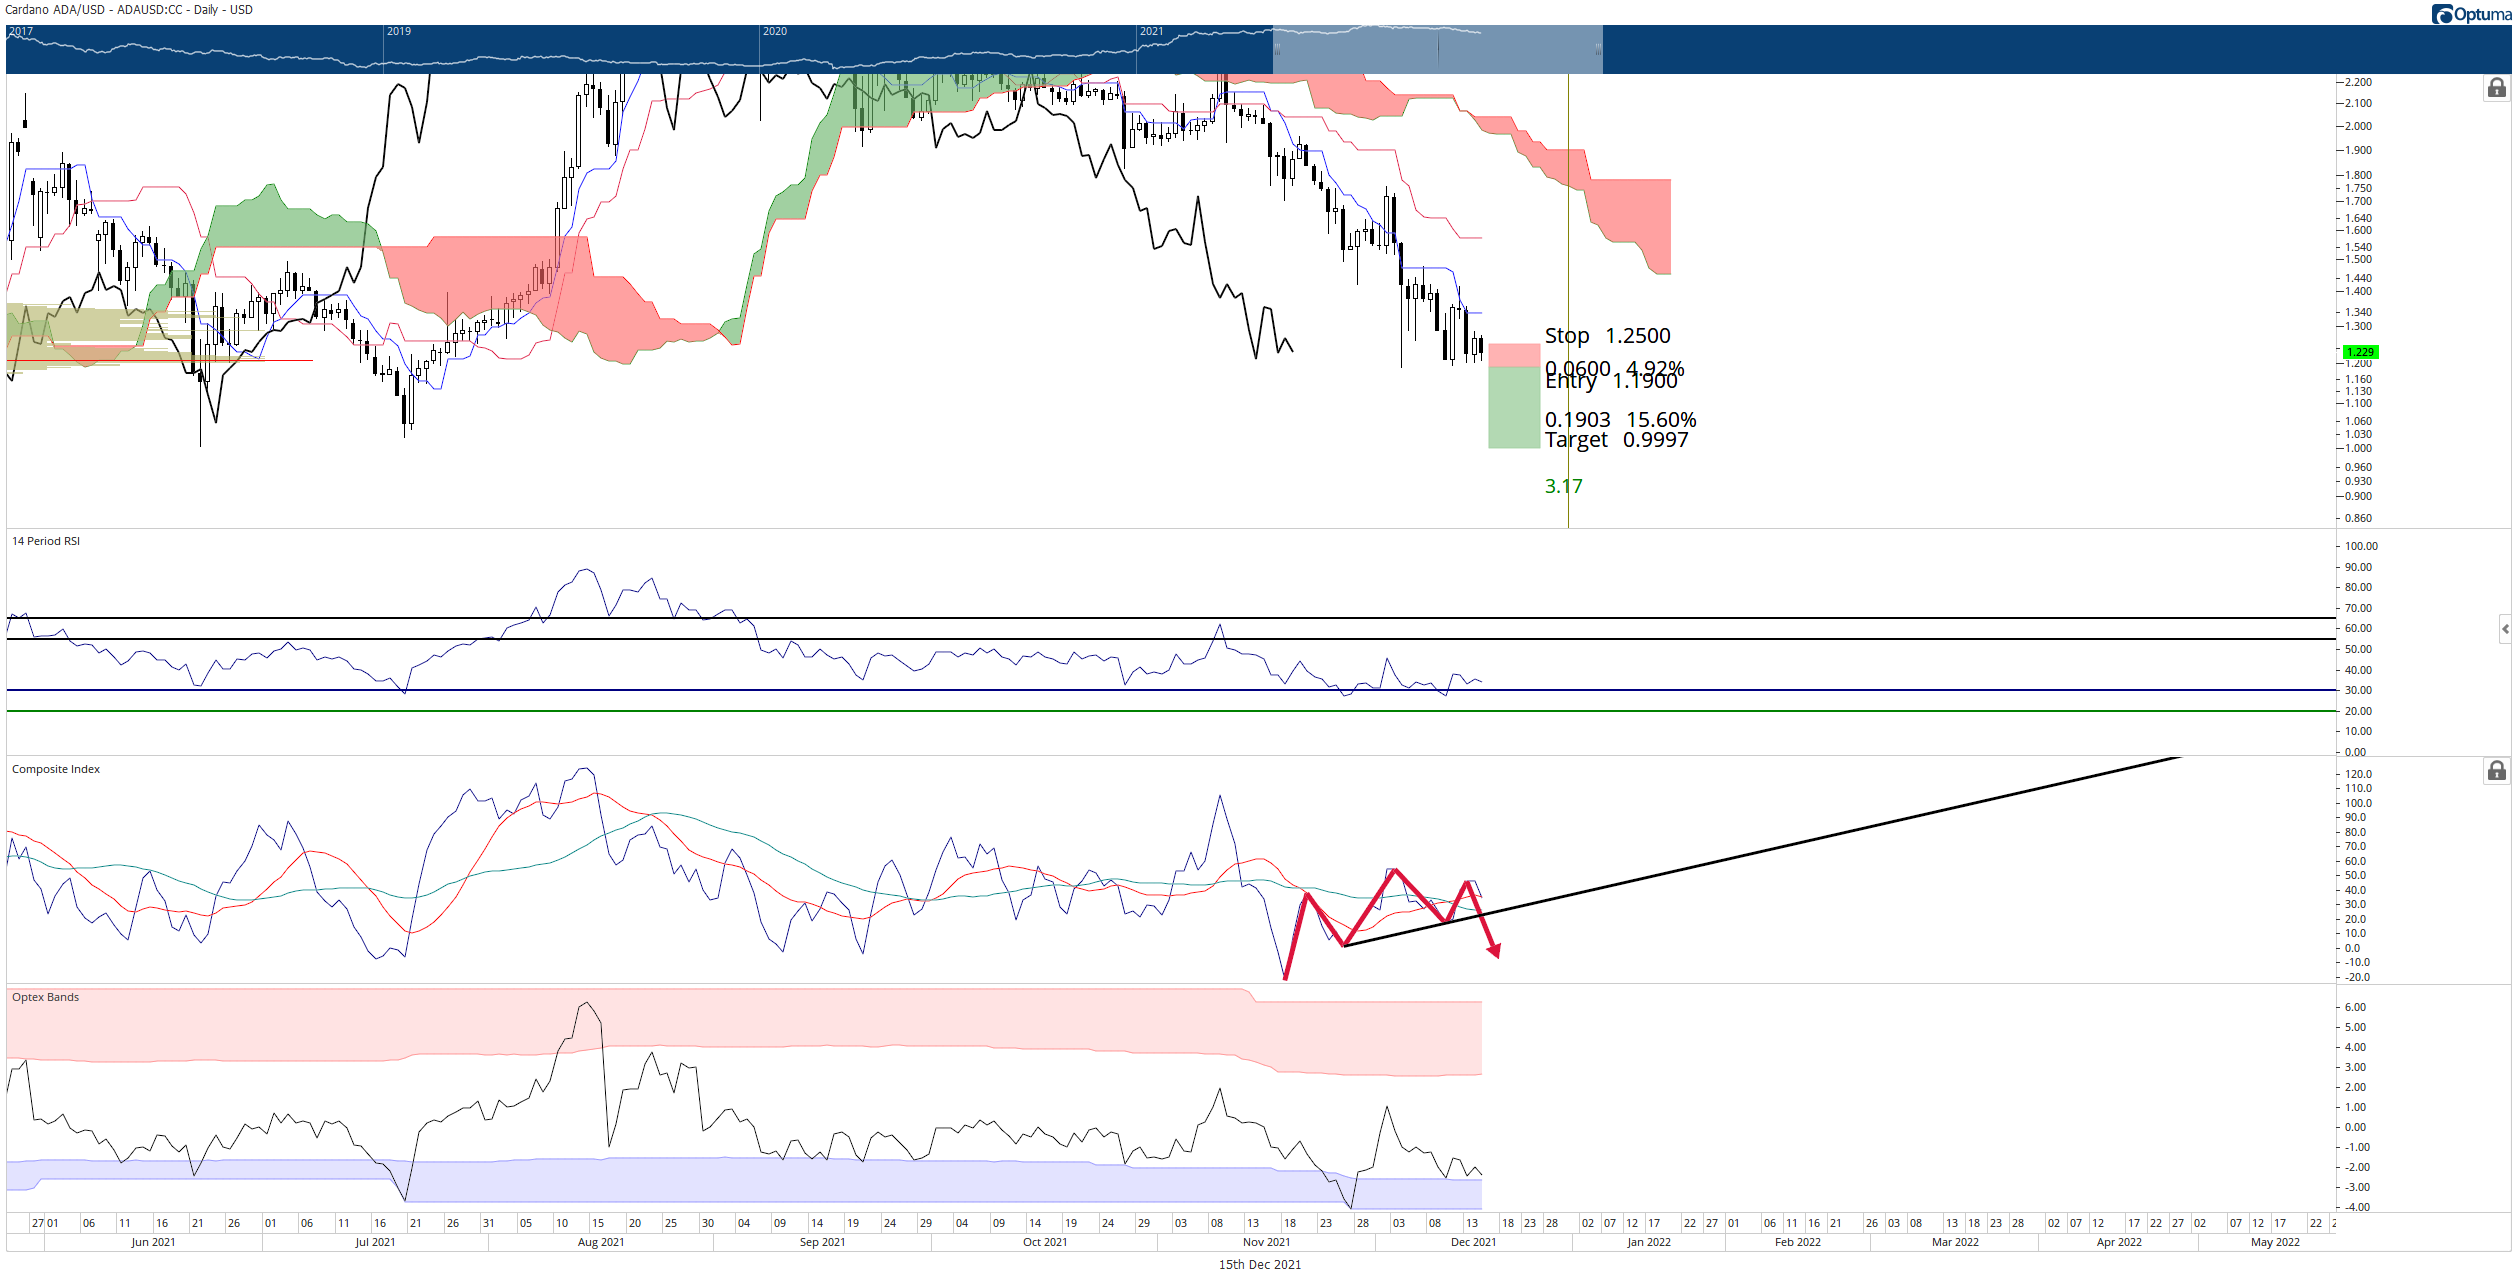
ADA/USD Daily Ichimoku Chart
Cardano price action is in a mixed situation when developing a clear directional bias. The trend on the daily chart is clearly bearish, but shows signs of exhaustion. On the other hand, the weekly chart is clearly bullish but is showing signs of converting into a bear market. One thing that is consistent on the daily chart is the shared support zone of 30 in the RSI and one other oscillator on each time frame showing extreme oversold conditions.
Note: All information on this page is subject to change. The use of this website constitutes acceptance of our user agreement. Please read our privacy policy and legal disclaimer. Opinions expressed at FXstreet.com are those of the individual authors and do not necessarily represent the opinion of FXstreet.com or its management. Risk Disclosure: Trading foreign exchange on margin carries a high level of risk, and may not be suitable for all investors. The high degree of leverage can work against you as well as for you. Before deciding to invest in foreign exchange you should carefully consider your investment objectives, level of experience, and risk appetite. The possibility exists that you could sustain a loss of some or all of your initial investment and therefore you should not invest money that you cannot afford to lose. You should be aware of all the risks associated with foreign exchange trading, and seek advice from an independent financial advisor if you have any doubts.
Recommended Content
Editors’ Picks
Ripple's move above this key level could trigger nearly 50% rally for XRP
Ripple has overcome a critical resistance level and flipped into a support floor on the weekly time frame. This development happened while XRP tightly consolidated for roughly 250 days. Investors can expect XRP to kickstart a massive rally.
Optimism price outlook with nearly $90 million worth of OP tokens flooding markets on Friday
Optimism volatility has shrunk in the ours leading to the network’s cliff unlock. It joins the likes of dYdX and Sui, which have similar events on their calendars. As token unlocks are often considered bearish catalysts, investors should brace for a reaction after the event.
Top 3 Price Prediction Bitcoin, Ethereum, Ripple: Retail watches from the sidelines with a bias for shorts
Bitcoin could clear $73,777 peak as BTC bulls resurface. Ethereum might fall 10% before next leg up as ETH RSI teases with sell signal. XRP could lose $0.6000 threshold as Ripple bulls fail to show up.
Jito price could hit $6 as JTO coils up inside this bullish pattern
Jito price action shows a potential cup and handle formation. Based on theoretical measurement rules, a successful breakout could yield a 56% rally to $6.0. A breakdown of the $3.86 support level would create a lower low for JTO and invalidate the bullish thesis.
Bitcoin: BTC may have recovered, but is it out of the woods?
Bitcoin’s (BTC) upward momentum has shown a significant decline for the past two weeks or so. This development led to a bearish signal on the weekly and an uncertain outlook on the monthly.