Buying Solana now to gain 700% profits by 2022
- Solana price has been on a massive run-up in 2021 from $1 to $216 in roughly eight months.
- This stellar climb is likely to continue into 2022 as significant bullish signs emerge.
- Moreover, the start of a new bull run will serve as a tailwind for SOL, propelling it by roughly 713%.

Solana price performance has been extraordinary in 2021, and this trend is likely to continue into 2022. There are three reasons for this optimism, all of which forecast a bullish outlook for SOL.
Solana price and Q4 crypto markets
Solana price is bullish and has been this way since its inception. The partners backing/investing in it include FTX’s Alameda Research, CMS Holdings and other big names. Moreover, SOL finds its place in many famous investors’ portfolios like Multicoin Capital, Sino Capital, etc. That these large yet important investors are backing the project with an “Ethereum-killer” narrative is one of the reasons for Solana’s exponential returns over the past eight months.
Unlike other Ethereum killers, which have never been able to stand up to Ethereum, let alone steal its market share, SOL has played a crucial role in DeFi and its events and continues to slowly siphon users away from the ETH ecosystem.
While Solana’s backing makes it extremely attractive as an investment, that is only half the reason. The other half includes the upcoming bull run – or bull run 2.0 if you will – which is more than likely to trigger altcoins to rally exponentially. But what makes this second phase intriguing and the most sought-after cycle is that it is happening in the last quarter of the year. From a historical perspective, Bitcoin bull runs tend to overextend in Q4. Altcoins, however, take this to a new level, increasing their market value multiple times.
We expect, therefore, that it will be in the second half of the run-up that the big buying will take place, with pressure from retail and institutions a significant tailwind to Solana price, as it reaches unfathomable levels.
Technicals to push SOL the rest of the way
From a technical perspective, the daily and weekly charts both show an interesting yet bullish outlook for Solana price. The daily time frame shows SOL rose 713% between July 21 to September 8, forming a flag pole - the first element in a bullish flag or pennant pattern. This exponential growth was followed by consolidation that created three lower highs and higher lows, resulting in a pennant forming when connected using trend lines.
Taken together, the run-up from July 21 to October 20 and the consolidation that followed is a continuation pattern known as the bullish pennant. This technical formation forecasts a 713% upswing to $1,336, obtained by adding the flag pole’s distance to the breakout point at $164. A more conservative estimate would be to extend the poll by a 61.8% Fibonacci ratio resulting in a surge of 440% to a price target of $721.60.
Solana price shattered the pennant’s upper trend line on October 20 and has rallied 21% to where it currently is. Going forward, investors can expect SOL to continue its 713% uptrend to reach its theoretical target of $1,336 or the more conservative $721.60 price objective.
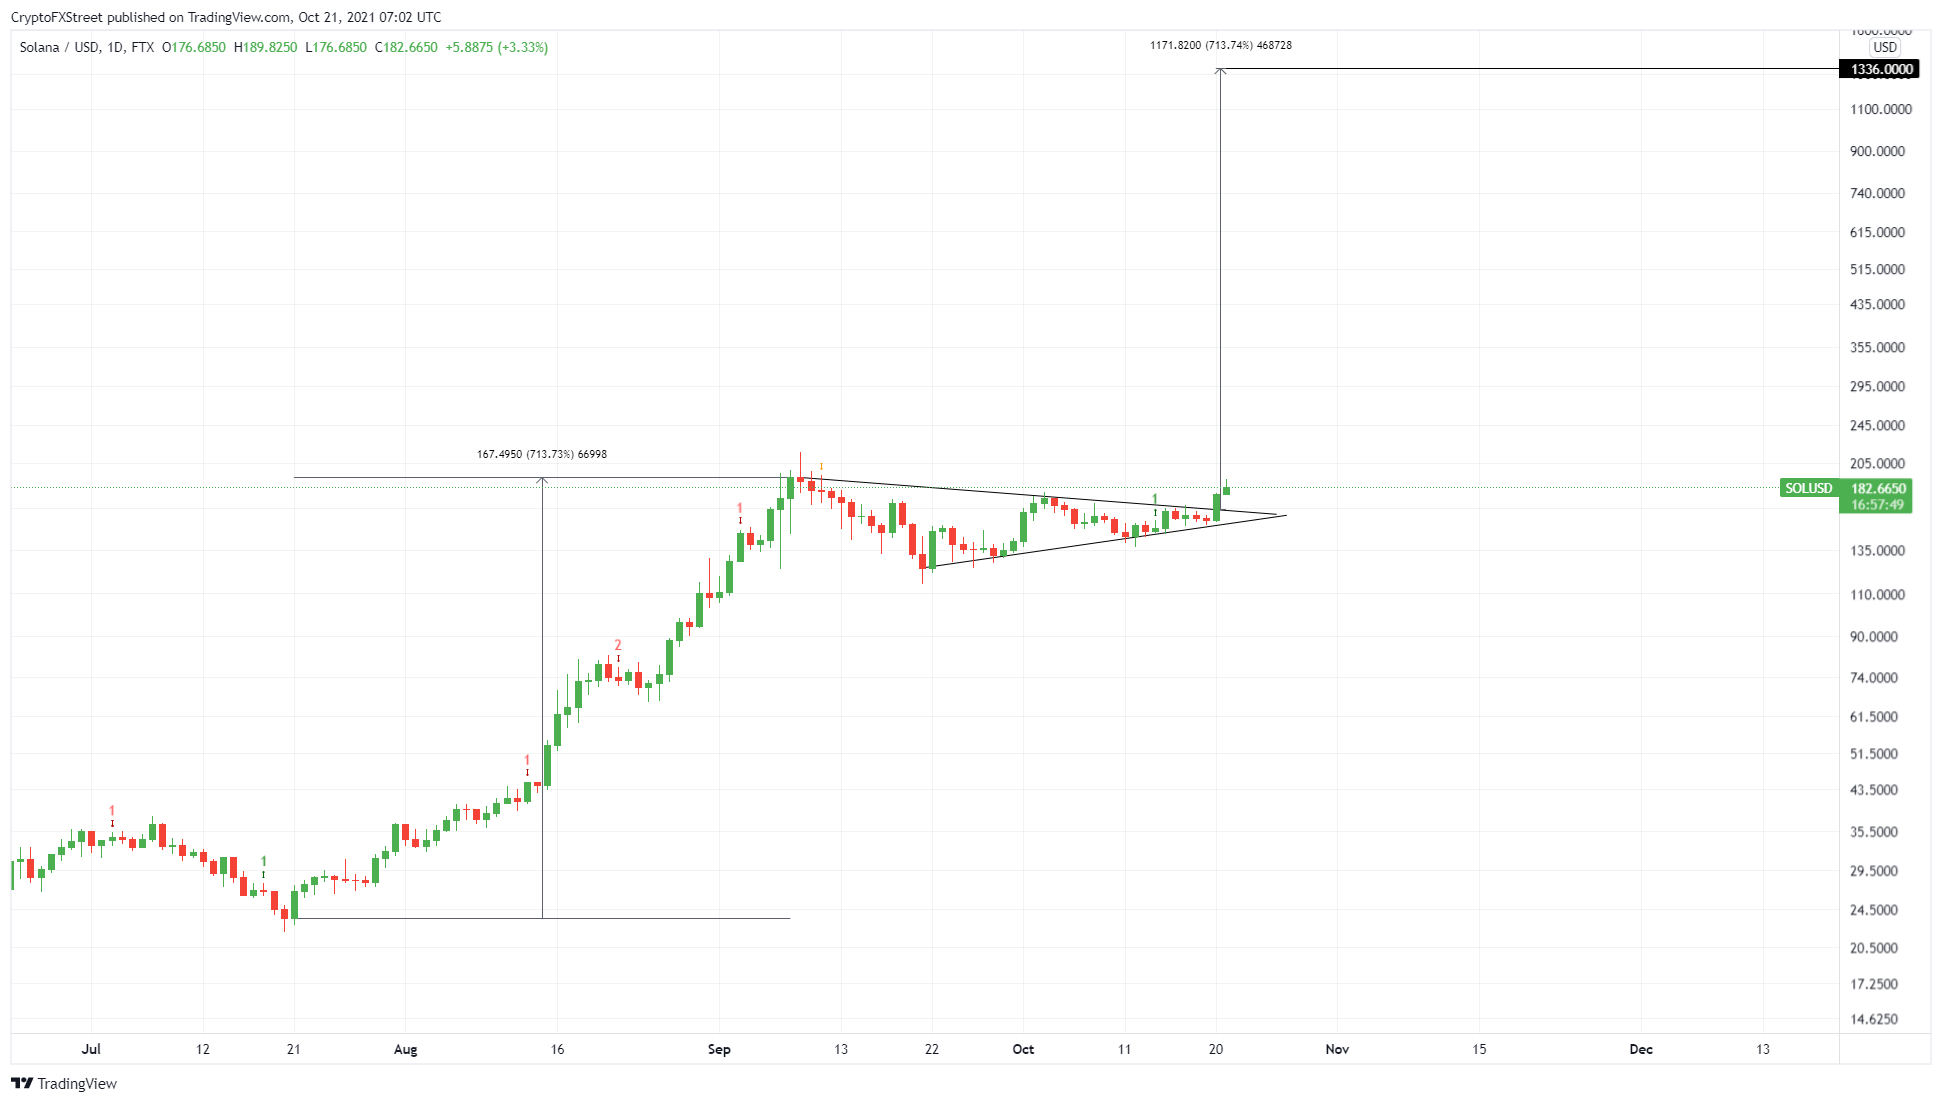
SOL/USDT 1-day chart
Interestingly, the weekly chart for Solana price shows that it is currently hovering above the $174 resistance level. This barrier has prevented SOL from climbing higher over the past five weeks, although the recent 21% run-up seems to have done the trick.
Investors should wait for a decisive close above $174 to confirm that this upswing was backed by genuine buyers. Assuming SOL flips the $174 hurdle, a retest of this barrier (although unlikely) will serve as a secondary confirmation and convert it into a support floor. This development is more than likely to kick-start a new bull run on a higher time frame.
What makes this climb more assuring is the red ‘one’ sell signal from the Momentum Reversal Indicator (MRI) on the weekly time frame. This indicates investors need not worry about an unforeseen sell-off or spike in selling pressure.
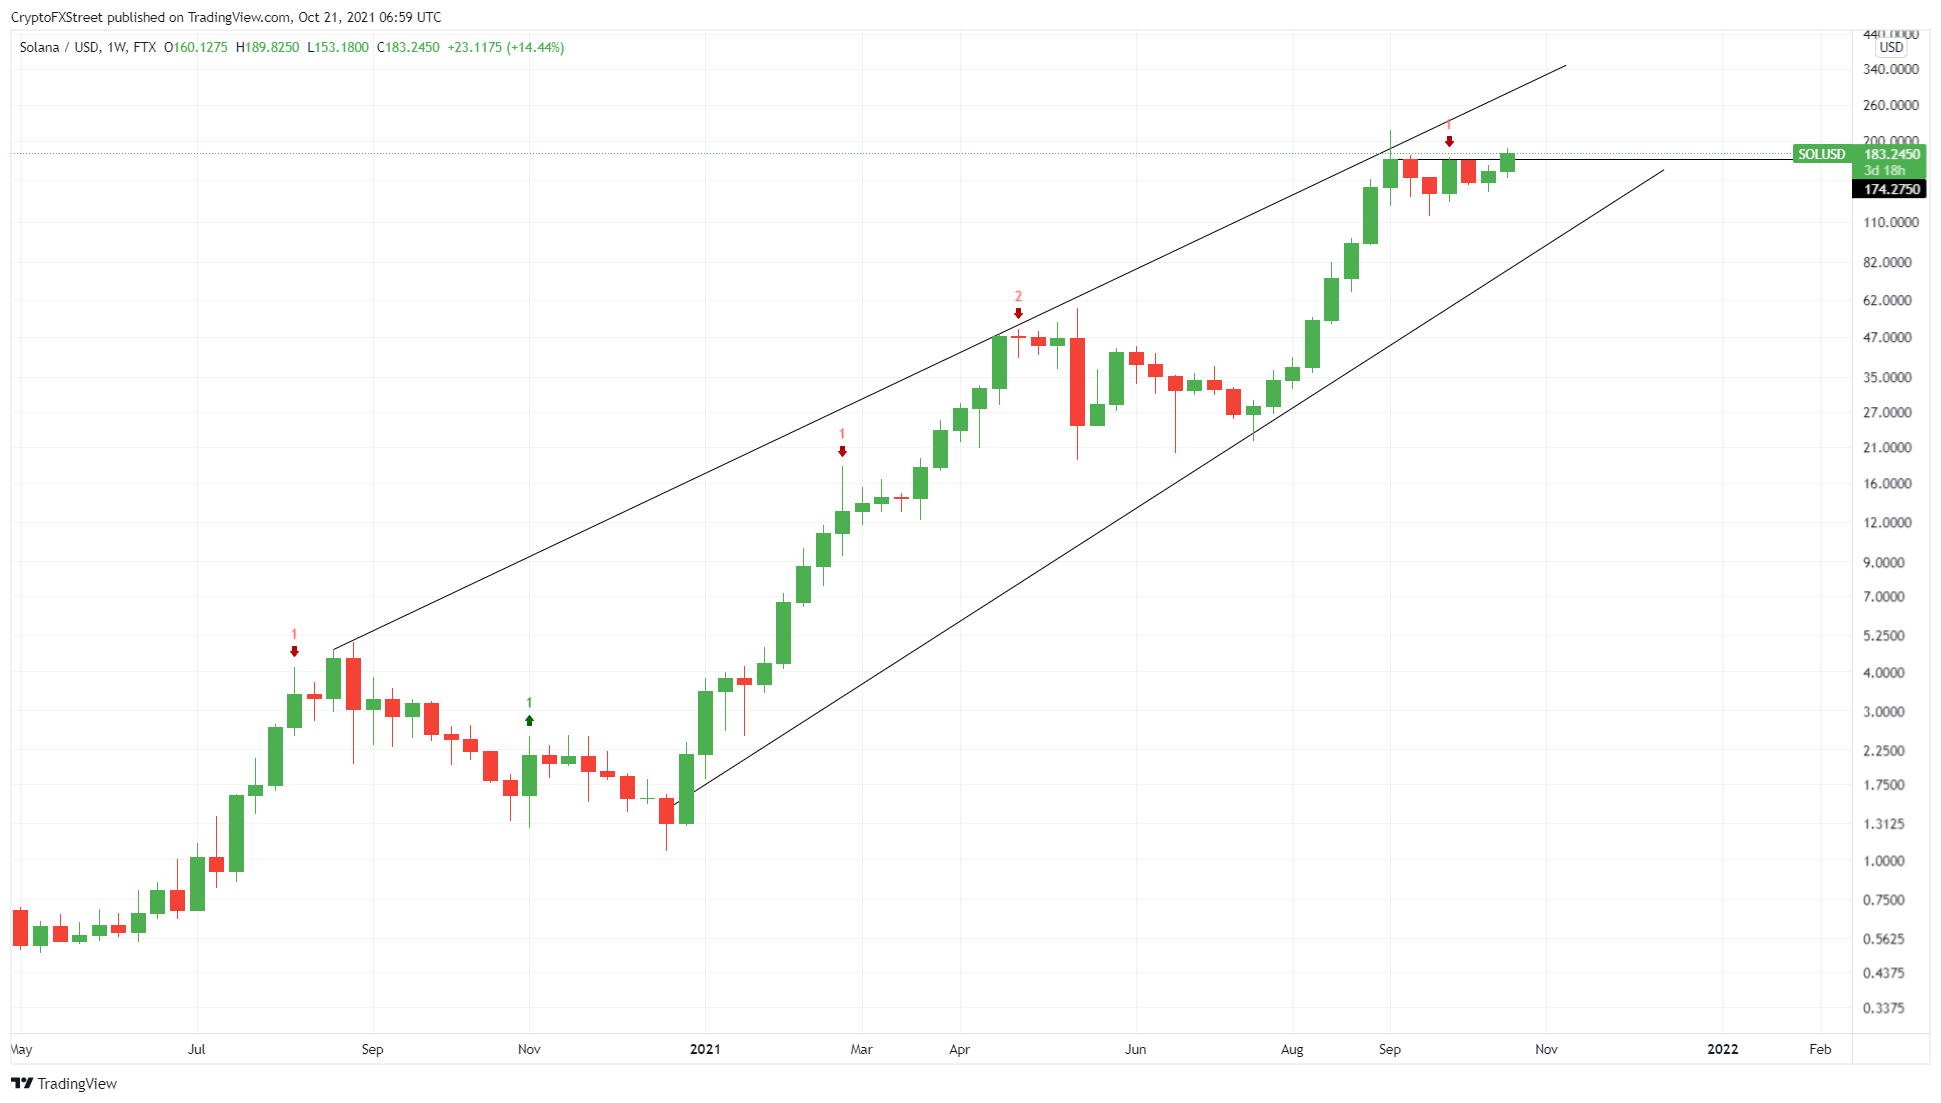
SOL/USDT 1-week chart
While things are looking up for Solana price, a breakdown of the lower trend line of the symmetrical triangle at around $143 will invalidate the bullish pennant. However, this does not invalidate the bullishness surrounding SOL. In some cases, this downswing could extend, pushing SOL to $130.
Author

Akash Girimath
FXStreet
Akash Girimath is a Mechanical Engineer interested in the chaos of the financial markets. Trying to make sense of this convoluted yet fascinating space, he switched his engineering job to become a crypto reporter and analyst.


