Bitcoin Weekly Forecast: Short-term holders add 1.12 million BTC, what does this mean?
- Bitcoin price remains bearish in the short term, forecasting a potential short-term downward correction.
- The weekly imbalance, stretching from $59,111 to $53,120, is an ideal accumulation zone.
- On-chain metrics support this outlook as short-term holders have accumulated 1.12 million BTC since late December 2023.

Bitcoin (BTC) price action for the past three weeks has been confusing for sidelined participants. On the one hand, investors are ignoring BTC and trading altcoins, and on the other hand, traders are expecting a potential dip.
Read more: Bitcoin price eyes $69K as supply shortages on exchanges drive banks to pursue BTC miners
Bitcoin price remains bearish on the weekly
On the weekly timeframe, the Momentum Reversal Indicator (MRI) has flashed a sell signal for Bitcoin's price. This sell signal is noted as a red ‘one’ down arrow above the weekly candlestick and forecasts a one-to-four-down candlestick.
Furthermore, the daily exchange volumes are also declining, as noted in a previous publication. Combining the sell signals with rising US Dollar strength and expectation of a potential easing in June, BTC could set the stage for a correction or a potential reversal.
If a correction were to unfold, the next logical zone of support would be around the weekly imbalance, stretching from $59,111 to $53,120.
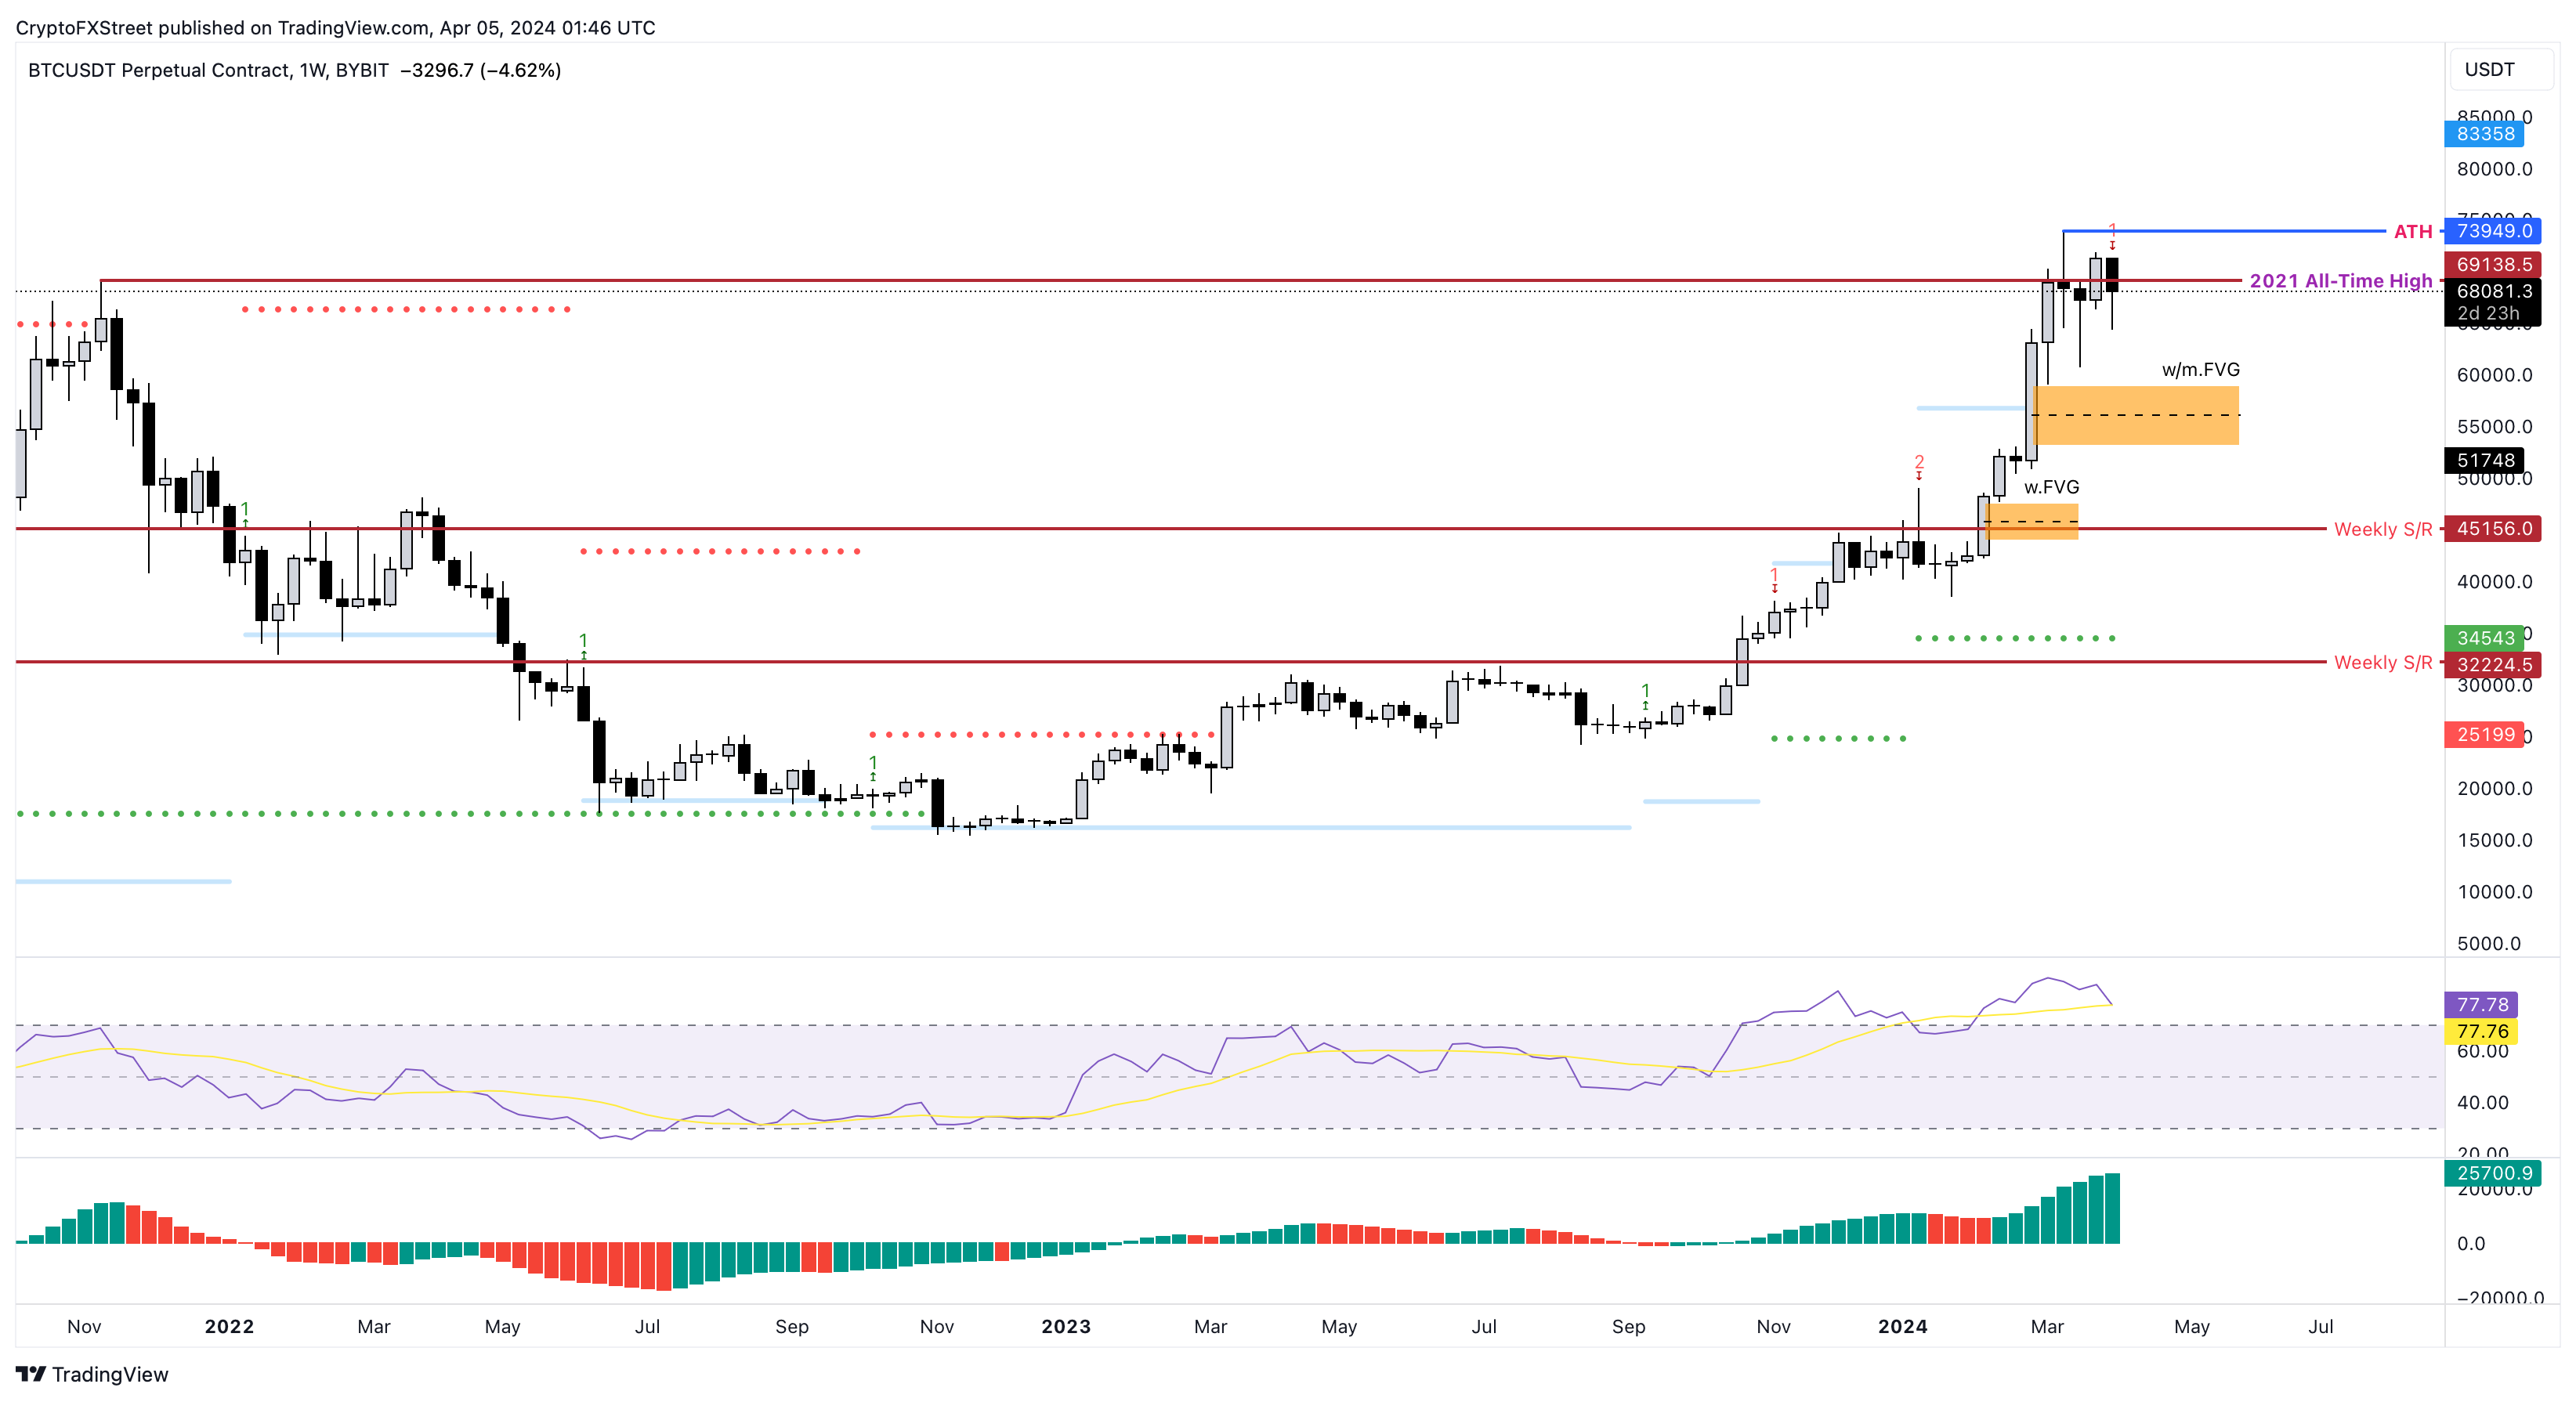
BTC/USDT 1-week chart
While Bitcoin’s weekly chart is bearish, no doubt, a closer look reveals that this correction could occur after a potential upswing on the lower timeframe.
BTC’s daily chart showcases lack of directional bias
Bitcoin price came close to retesting the weekly imbalance, extending from $59,111 to $53,120, on March 20, but sellers were out of steam, which led to buyers’ rescuing BTC. However, the recovery rally from this point was also lackluster, and it faced a slowdown around the previous all-time high (ATH) of $69,138.
As mentioned in a previous FXStreet publication, a sweep of the ATH at $73,949 on the daily, creating a swing failure pattern or rejection here, could further confirm a potential reversal. But so far, none of the mentioned scenarios has unfolded. Instead, BTC is moving sideways, consolidating between the current ATH and $60,761.
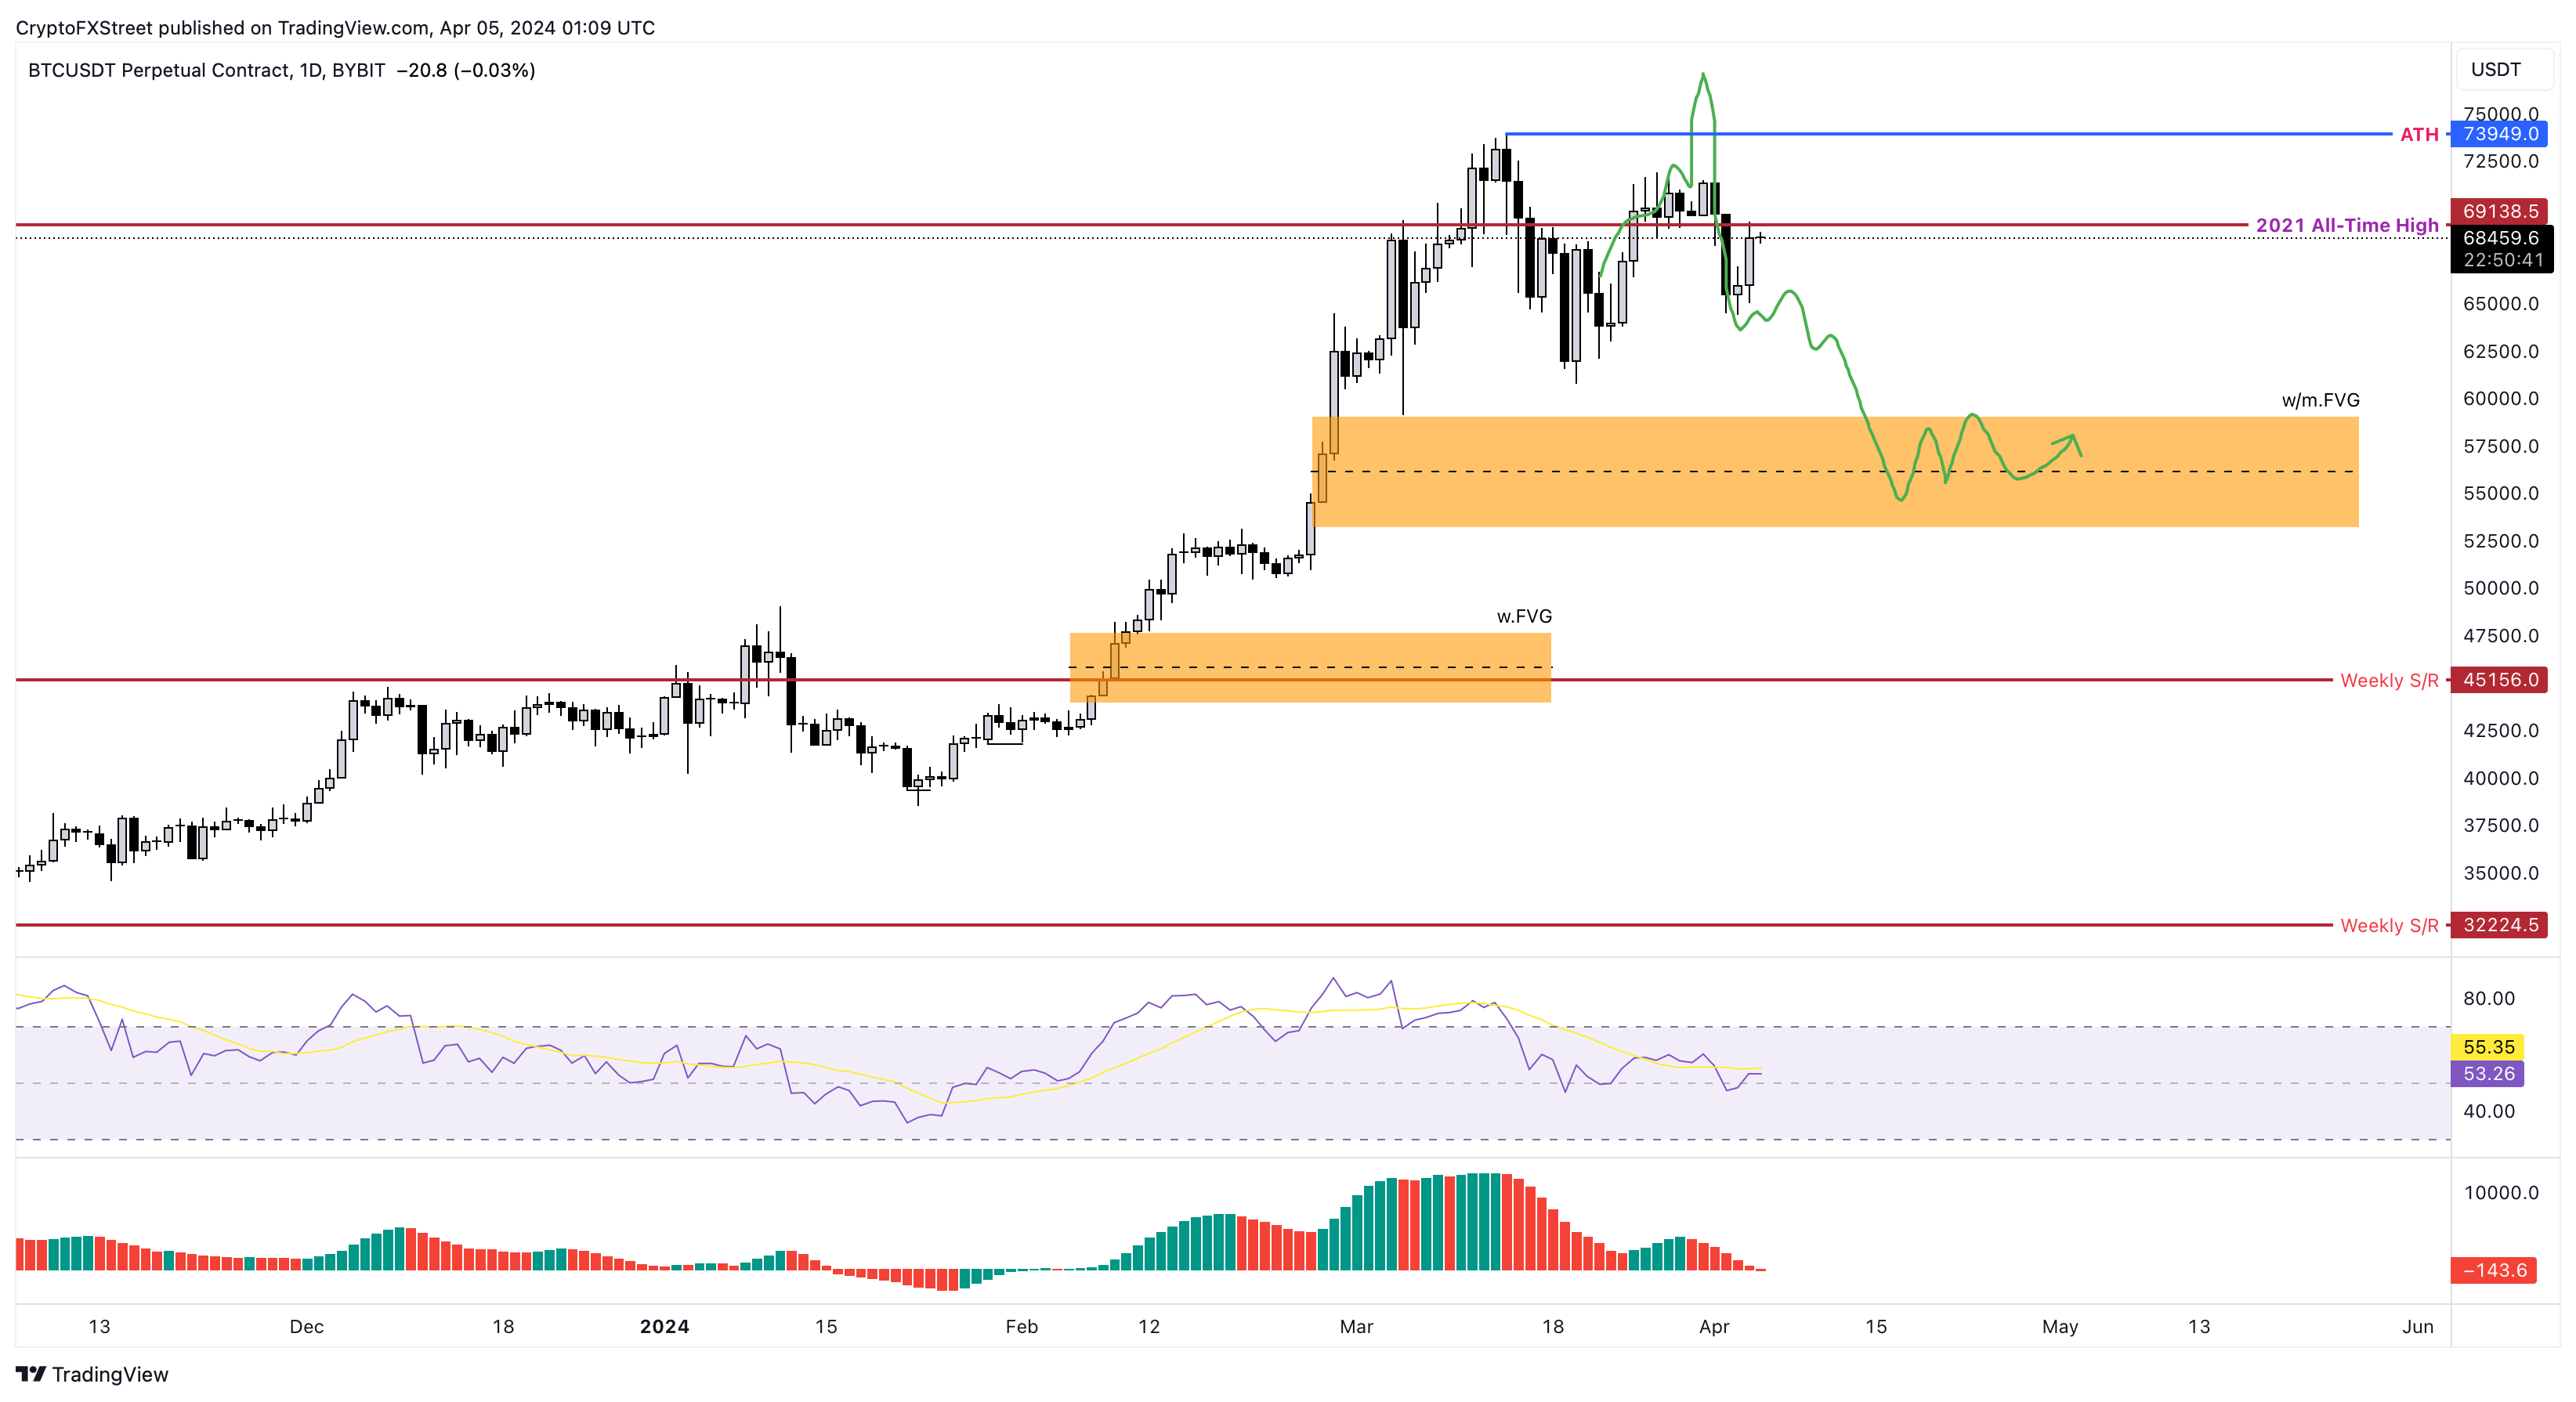
BTC/USDT 1-day chart
So, what’s next? A look at BTC's historical price performance might give investors some idea.
The monthly returns table for Bitcoin shows that the second quarter yielded an average BTC return of 30%, compared to the first quarter’s 11.41%. Additionally, the second quarter, in general, has seen very few negative returns in the past decade. So, with that line of thinking in mind, investors should expect smooth sailing for BTC, at least from a historical perspective.
To make things more interesting, the average return for April is ranked the second highest in the past decade, making the current month something to watch out for.

BTC Average Returns
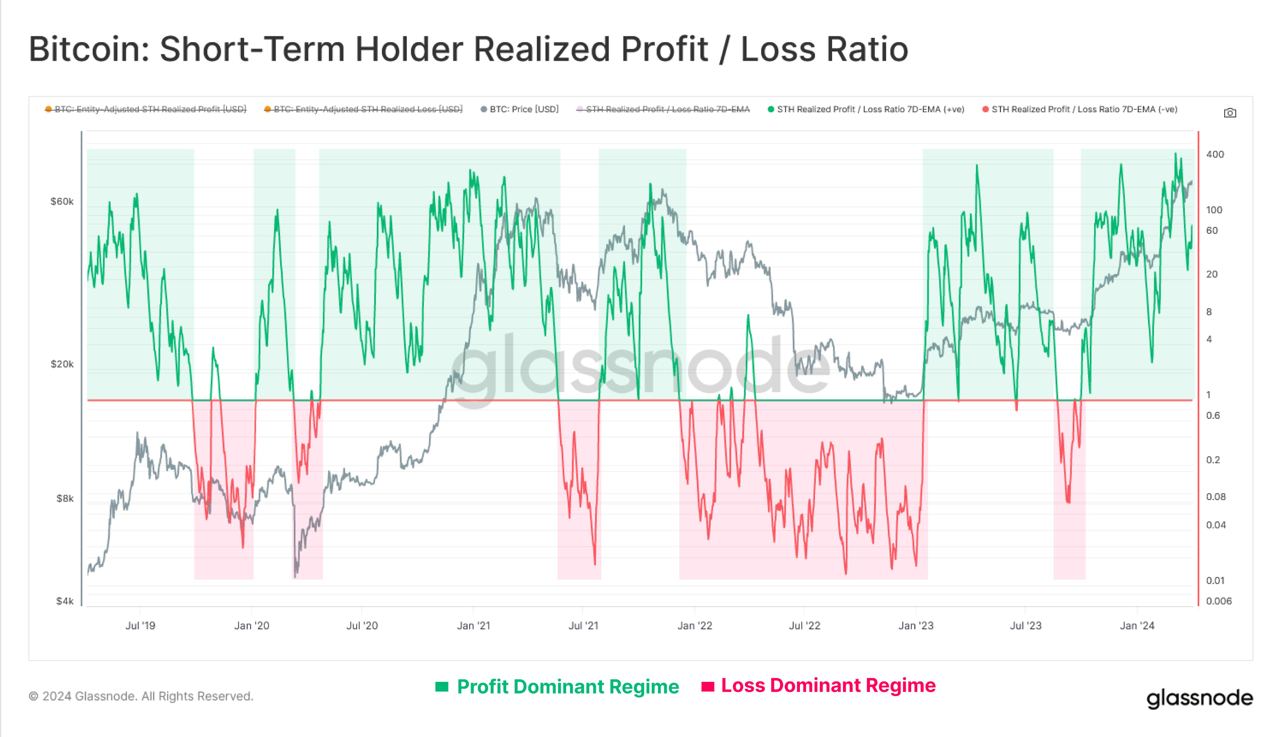
Additionally, Glassnode’s data since late December 2023 shows that the BTC held by short-term holders has been climbing rapidly while the long-term holders have been distributing. This development has created a divergence between STH and LTH supply, showing an addition of 1.12 million BTC by the former.
This outlook, at least from a high timeframe perspective, reveals a development that investors need to be cautious about. Generally, a spike in STH is bearish since these investors are not known for their patience. Hence, should a scenario threaten their holdings, these holders should offload their BTC, triggering a steep correction in Bitcoin price.
BTC Long/Short-term Holder Threshold
While the correction thesis forecasts a pullback in Bitcoin price, it does not necessarily mean a reversal. A dip into the aforementioned weekly imbalance would be key for sidelined buyers to accumulate.
Regardless, an invalidation of the bearish outlook will occur if Bitcoin price recovers above April’s monthly candlestick open of $71,378. A weekly candlestick close above the said level would reinforce the idea that the bulls are in control. Such a development should be followed up with the 2021 ATH of $69,138 serving as support.
If these conditions are met, the bearish thesis will be invalidated, and the resulting bounce could propel Bitcoin price to a new ATH of $75,000.
Author

Akash Girimath
FXStreet
Akash Girimath is a Mechanical Engineer interested in the chaos of the financial markets. Trying to make sense of this convoluted yet fascinating space, he switched his engineering job to become a crypto reporter and analyst.


