Bitcoin price could hit a new ATH, but there’s a caveat to this bounce
- Bitcoin price recovery rally hints at a new ATH around the $74,000 to $75,000 range.
- Declining BTC spot ETF inflows indicate room for a correction.
- A sweep of the current ATH of $73,949 could lead to a dip into the $59,111 to $53,120 weekly imbalance.

Bitcoin’s weekly sell signal, as mentioned in the previous publication, seems to have played out without providing a dip into a key range. This premature bounce could be a short squeeze that eventually catches the eager bulls off guard.
Also read: Why is the crypto market crashing?
Bitcoin spot ETF flows have a lagging impact
Unlike the crypto markets, where data is readily available without delays, the traditional markets are a different story. The Bitcoin ETF flow data is delayed and, hence, a lagging indicator. According to CoinGlass data, after noting the highest inflow of $1.04 billion on March 13, the inflows started to decline sharply. On March 18, there was a net outflow of $154 million, which eventually declined to the largest netflow of -$326 million on March 19.
Interestingly, this decline in net flows coincided with the drop in Bitcoin's price in the past week.

BTC ETF flows
Hence, if the outflows continue to dominate, the current Bitcoin price bounce could soon see a steep correction.
Read more: Bitcoin Weekly Forecast: Can BTC hit $100,000 without a correction?
BTC price bounce promises a new ATH
On the daily chart, Bitcoin price shows that the bullish trend is still intact. Although BTC came close to retesting the $59,111 to $53,120 weekly imbalance, it failed. The premature spike in buying pressure has led to a promising recovery rally, which is reminiscent of what occurred during the top formation in November 2021.
However, unlike 2021, a reversal is unlikely, considering the bullish market conditions. Hence, investors could see a correction that stabilizes inside the aforementioned weekly imbalance.
The Relative Strength Index bouncing off the' 50' mean level supports this fluke rally or a sweep of the new ATH of $73,949, suggesting the end of bullish exhaustion and the potential start of another leg up.
A sell-off or profit-taking around $74,000 or the $75,000 psychological level is the sell signal investors should keep an eye out for. This development could lead to a correction into the aforementioned imbalance liquidating the newly opened long positions.
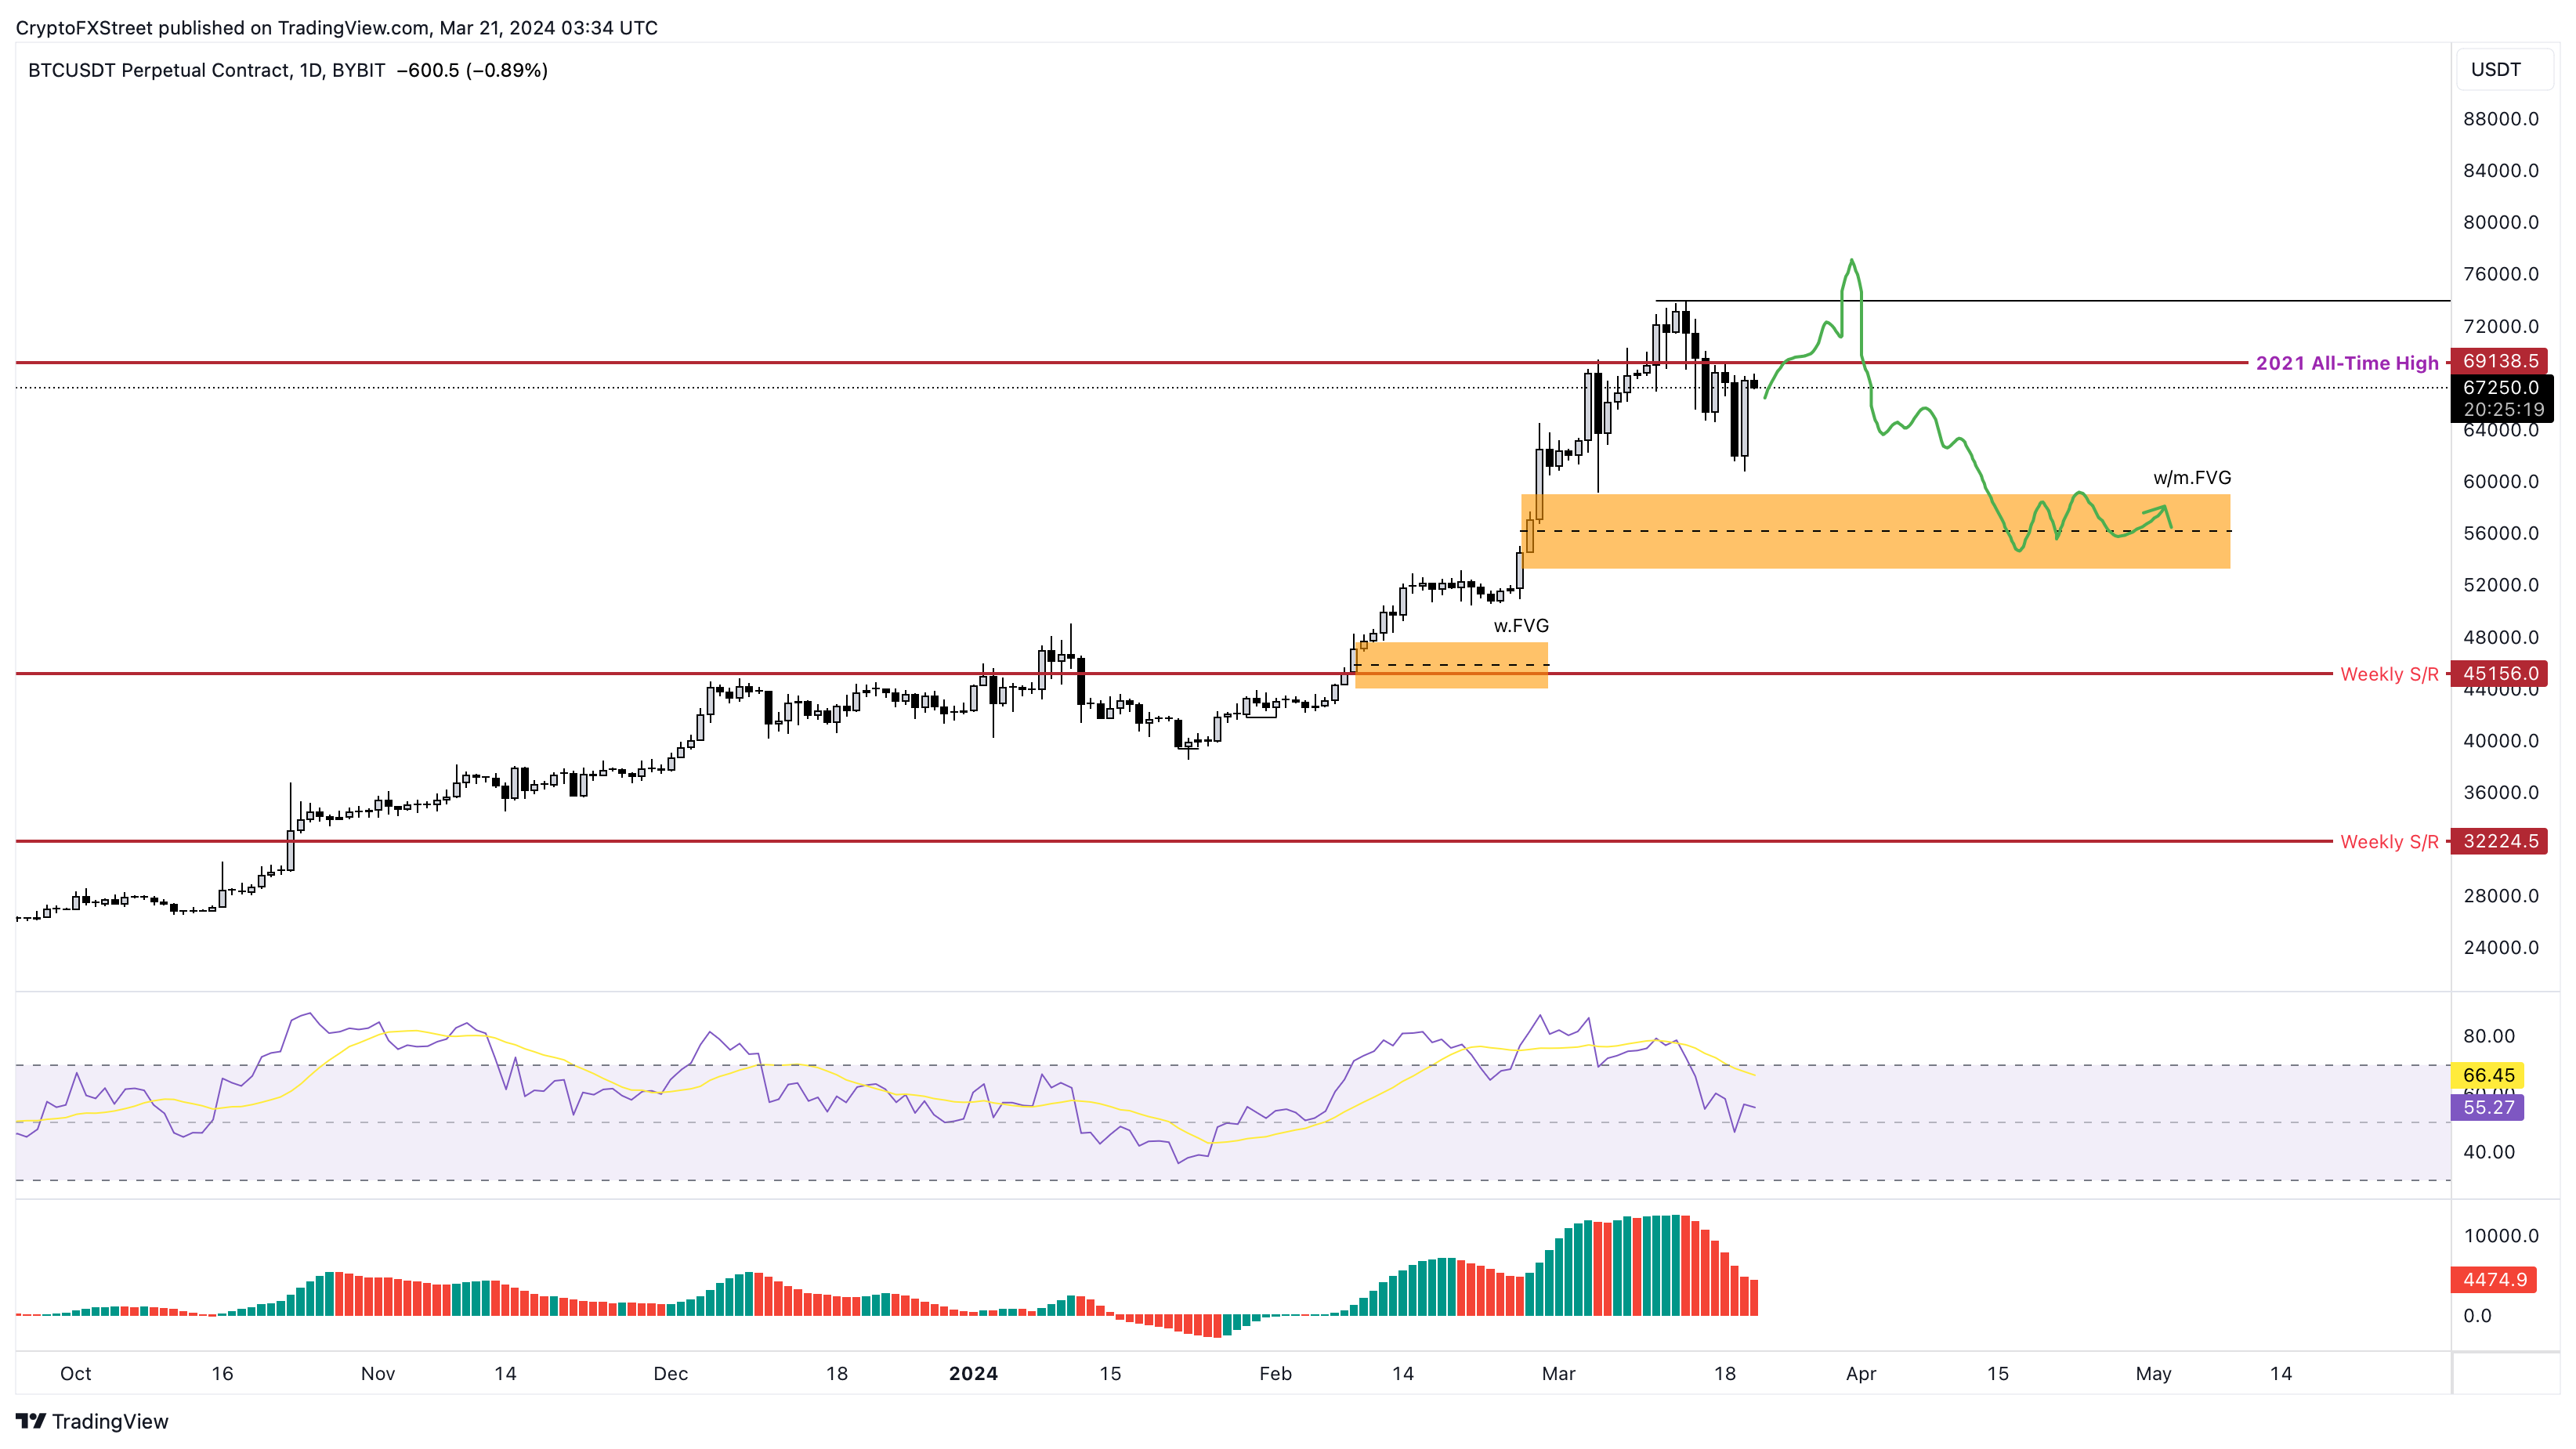
BTC/USDT 1-day chart
Invalidating this bearish outlook for Bitcoin price is a spike in buying pressure that pushes BTC to flip $75,000 into a support level. If this move stabilizes above the said level, it would allow accumulation from sidelined buyers to push BTC to the next key level of $80,000.
Author

Akash Girimath
FXStreet
Akash Girimath is a Mechanical Engineer interested in the chaos of the financial markets. Trying to make sense of this convoluted yet fascinating space, he switched his engineering job to become a crypto reporter and analyst.


