Bitcoin Weekly Forecast: Has BTC found a local price bottom?
- US spot Bitcoin ETFs registered slight outflows this week.
- Lower US inflation data boosted prices temporarily, but gains were undone after the Fed's hawkish interest-rate projections.
- Prices look set for a further correction before the uptrend can continue, technical indicators show.

Bitcoin (BTC) price looks set for a mild fall this week, weighed by slight outflows in the US spot ETFs and the US Federal Reserve (Fed) keeping a hawkish interest-rate outlook despite easing inflation. Technical indicators suggest that BTC could face a further 5% correction in the short term before resuming the uptrend
Bitcoin spot ETFs display weakness
According to CryptoQuant data for Bitcoin ETFs, the Historical Bitcoin Holdings Trend (Aggregated) metric provides a retrospective view of the cumulative Bitcoin holdings across all ETF issuers. Increases or decreases in the metric indicate shifts in institutional demand for Bitcoin exposure or changes in investment strategies.
US spot Bitcoin ETFs experienced slight outflows this week, with holdings dropping from 883.4K on Monday to 880.5K on Friday. This reduction hints at a minor waning of investor confidence, potentially foreshadowing a temporary dip in Bitcoin's price before resuming its upward momentum
%20(2)-638539623919770196.png)
BTC Etfs Historical Bitcoin Holdings Trend (Aggregated) chart
Bitcoin price effects by FOMC meetings
Bitcoin price is compared with the effects of the Federal Open Market Committee (FOMC) meeting held between the months of February and May.
The chart below shows that the Bitcoin price declined roughly 5% to 10% in the last forty-eight hours before the FOMC meeting, which has previously been marked as the local price bottom for BTC. After which BTC prices have rallied to the upside.
In the current scenario, the FOMC meeting was held on June 12. Forty-eight hours before the meeting, BTC saw a roughly 5% decline from $69,667 to $66,144. If history repeats, then BTC's price could have a final dip of an additional 5% from its current price of $66,632, forming a local price bottom around $63,500 and then rallying to the upside.
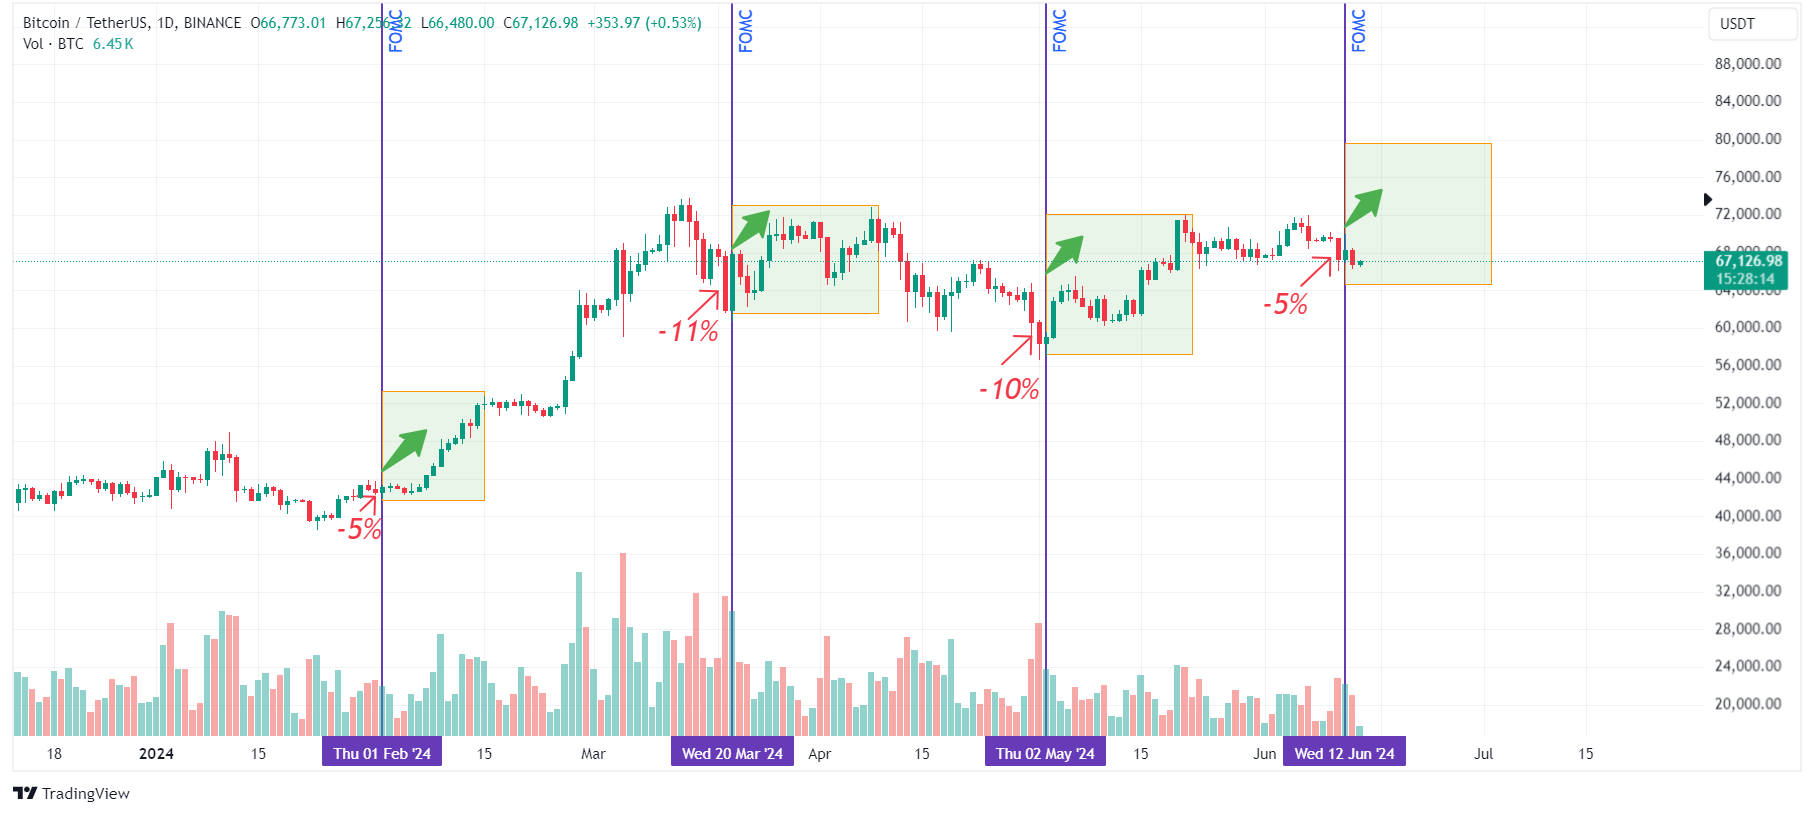
BTC/USDT 1day chart
Bitcoin price still faces uncertainty
Data from Santiment’s Defi liquidations on Aave and Compound, a money market protocol built on the Ethereum blockchain, where users can earn interest by lending their assets and borrowers can obtain loans by using their assets as collateral.
Liquidation on the Defi platform Aave and Compound for BTC refers to the process of selling a borrower's collateralized Bitcoin assets to repay a portion or all of their outstanding debt.
However, if the value of the borrowed assets exceeds a certain threshold in relation to the collateral's value, known as the liquidation threshold, then the borrower's position becomes vulnerable to liquidation.
When a borrower's position is liquidated, their BTC collateral is sold on the open market to cover the debt, ensuring that lenders are not left with losses due to undercollateralized loans.
When such Liquidation occurs on Aave and Compound, it is denoted by a spike given in the chart below.
Historically, these spikes are followed by market recoveries due to immediate forced selling followed by opportunistic buying from key stakeholders.
As in BTC’s case, the recent price decline from $71,656 to $66,815 on June 7 to 10, has seen no liquidation in Defi platforms. This indicates that BTC could first face a price decline before it reclaims its all-time high of $73,777 on March 14.
%20[11.47.40,%2014%20Jun,%202024]-638539625740175992.png)
BTC Defi Liquidations chart
Bitcoin price daily candlestick closes below the weekly support level of $67,147 on Thursday.
BTC could have a short-to-mid-term downward correction of 5% from its current trading price at $66,632 in the coming days, tagging the midpoint level of the price imbalance between $63,118 and $64,602 at $63,813.
This midpoint level also roughly coincides with the 50% retracement level at $64,240, calculated from the swing low of $56,523 on May 1 to a swing high of $71,994 on May 21.
If BTC bounces off $63,813, it could rally 12 % to reach its previous resistance level of $71,280.
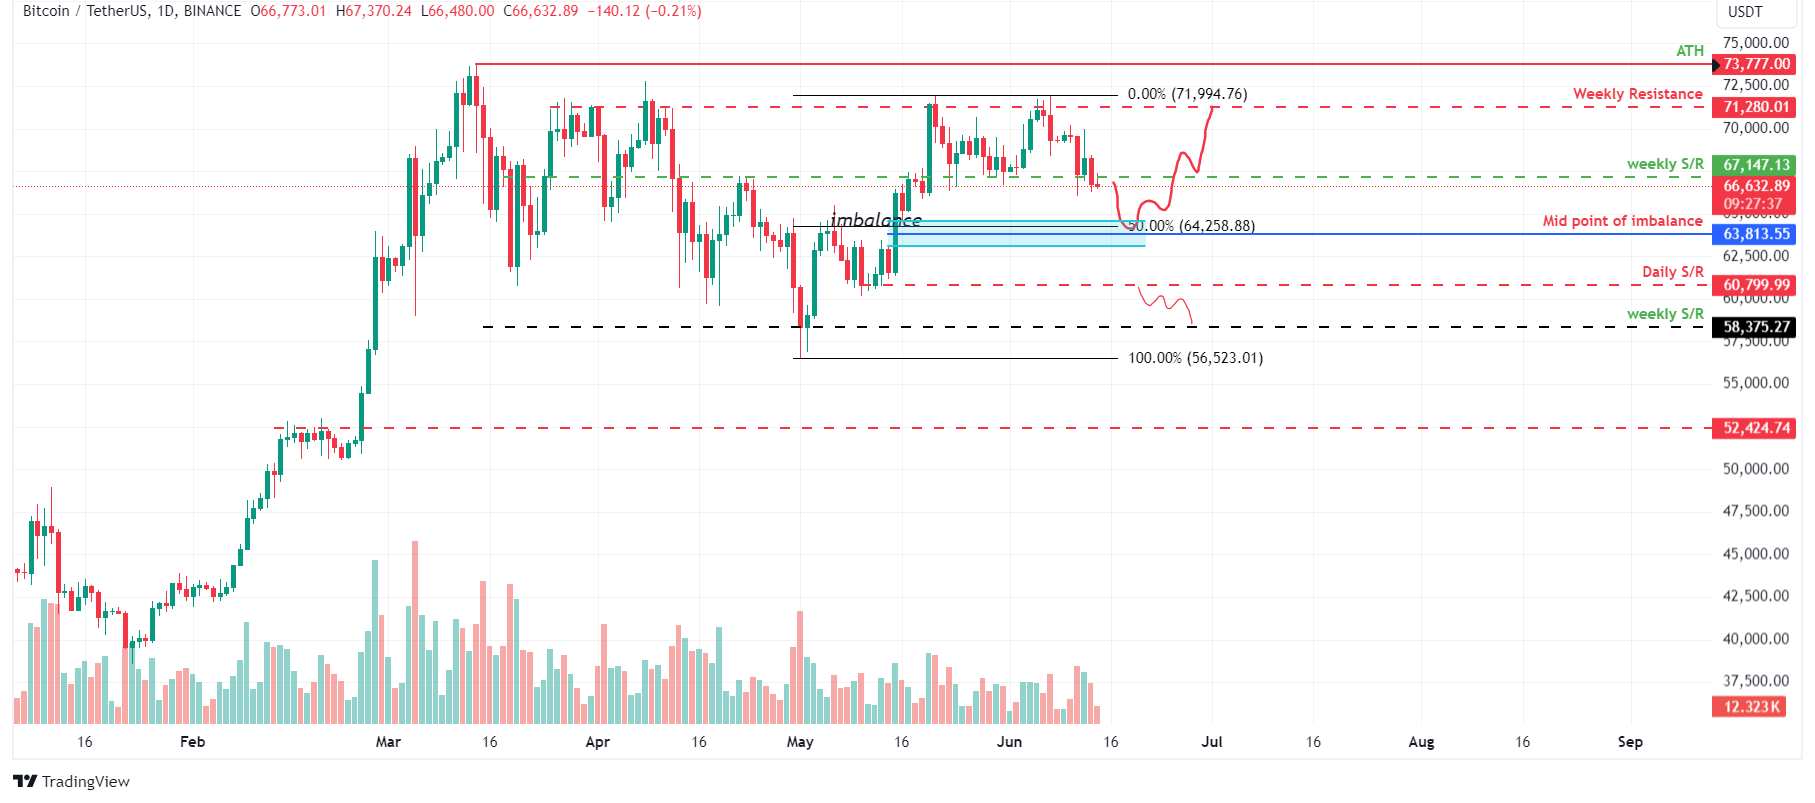
BTC/USDT 1-day chart
On the other hand, if BTC breaks and closes below its daily support level of $60,800, the bullish thesis could be invalidated, leading to a 4% crash, its weekly support level of $58,375.
Author

Manish Chhetri
FXStreet
Manish Chhetri is a crypto specialist with over four years of experience in the cryptocurrency industry.


