Bitcoin Weekly Forecast: BTC price remains indecisive despite strong fundamentals
- Bitcoin price continues its two-month consolidation with no end in sight.
- On-chain metrics for BTC show investor sentiment remains bullish in the long term.
- If buyers fail to produce a higher high above $47,000, potential correction levels to watch include $34,000 and $30,000.

Bitcoin (BTC) price shows no signs of directional bias in the short term as it trades around $43,000. But the on-chain metrics reveal a clear bullish signal that could potentially kick-start the bull run.
Also read: Valkyrie spreads risk, diversifies custody for its BRRR Bitcoin ETF between BitGo and Coinbase
Bitcoin price consolidation shows no end
Bitcoin price tagged $48,662 on January 11, which is the 61.80% Fibonacci retracement level of the bear market registered between November 2021 and November 2022. Since then, BTC has been consolidating around this level, reaching a low of $38,505 on January 23.
There are two scenarios on how the Bitcoin price action could play out:
- A continuation of the uptrend after creating a swing low at $38,505 on January 23.
- A deep correction to the $34,000 level.
- A local top formation at $48,662, followed by a reversal of the bull run and formation of new lows.
Read more: Bitcoin price scenarios to consider with approaching BTC halving event
While outlook three is highly unlikely at this point, many investors are expecting a correction that flushes out late longs, resting around the $35,000 to $34,000 region. But considering the recent dip into the weekly imbalance below $40,000 and the bullish Swing Failure Pattern (SFP) it created as a result, the chances of a continuation of the uptrend are highly likely.
If the uptrend fails to kick-start here, there is a high probability that the Bitcoin price could continue to trade directionlessly. This development could extend from a few days to a few weeks.
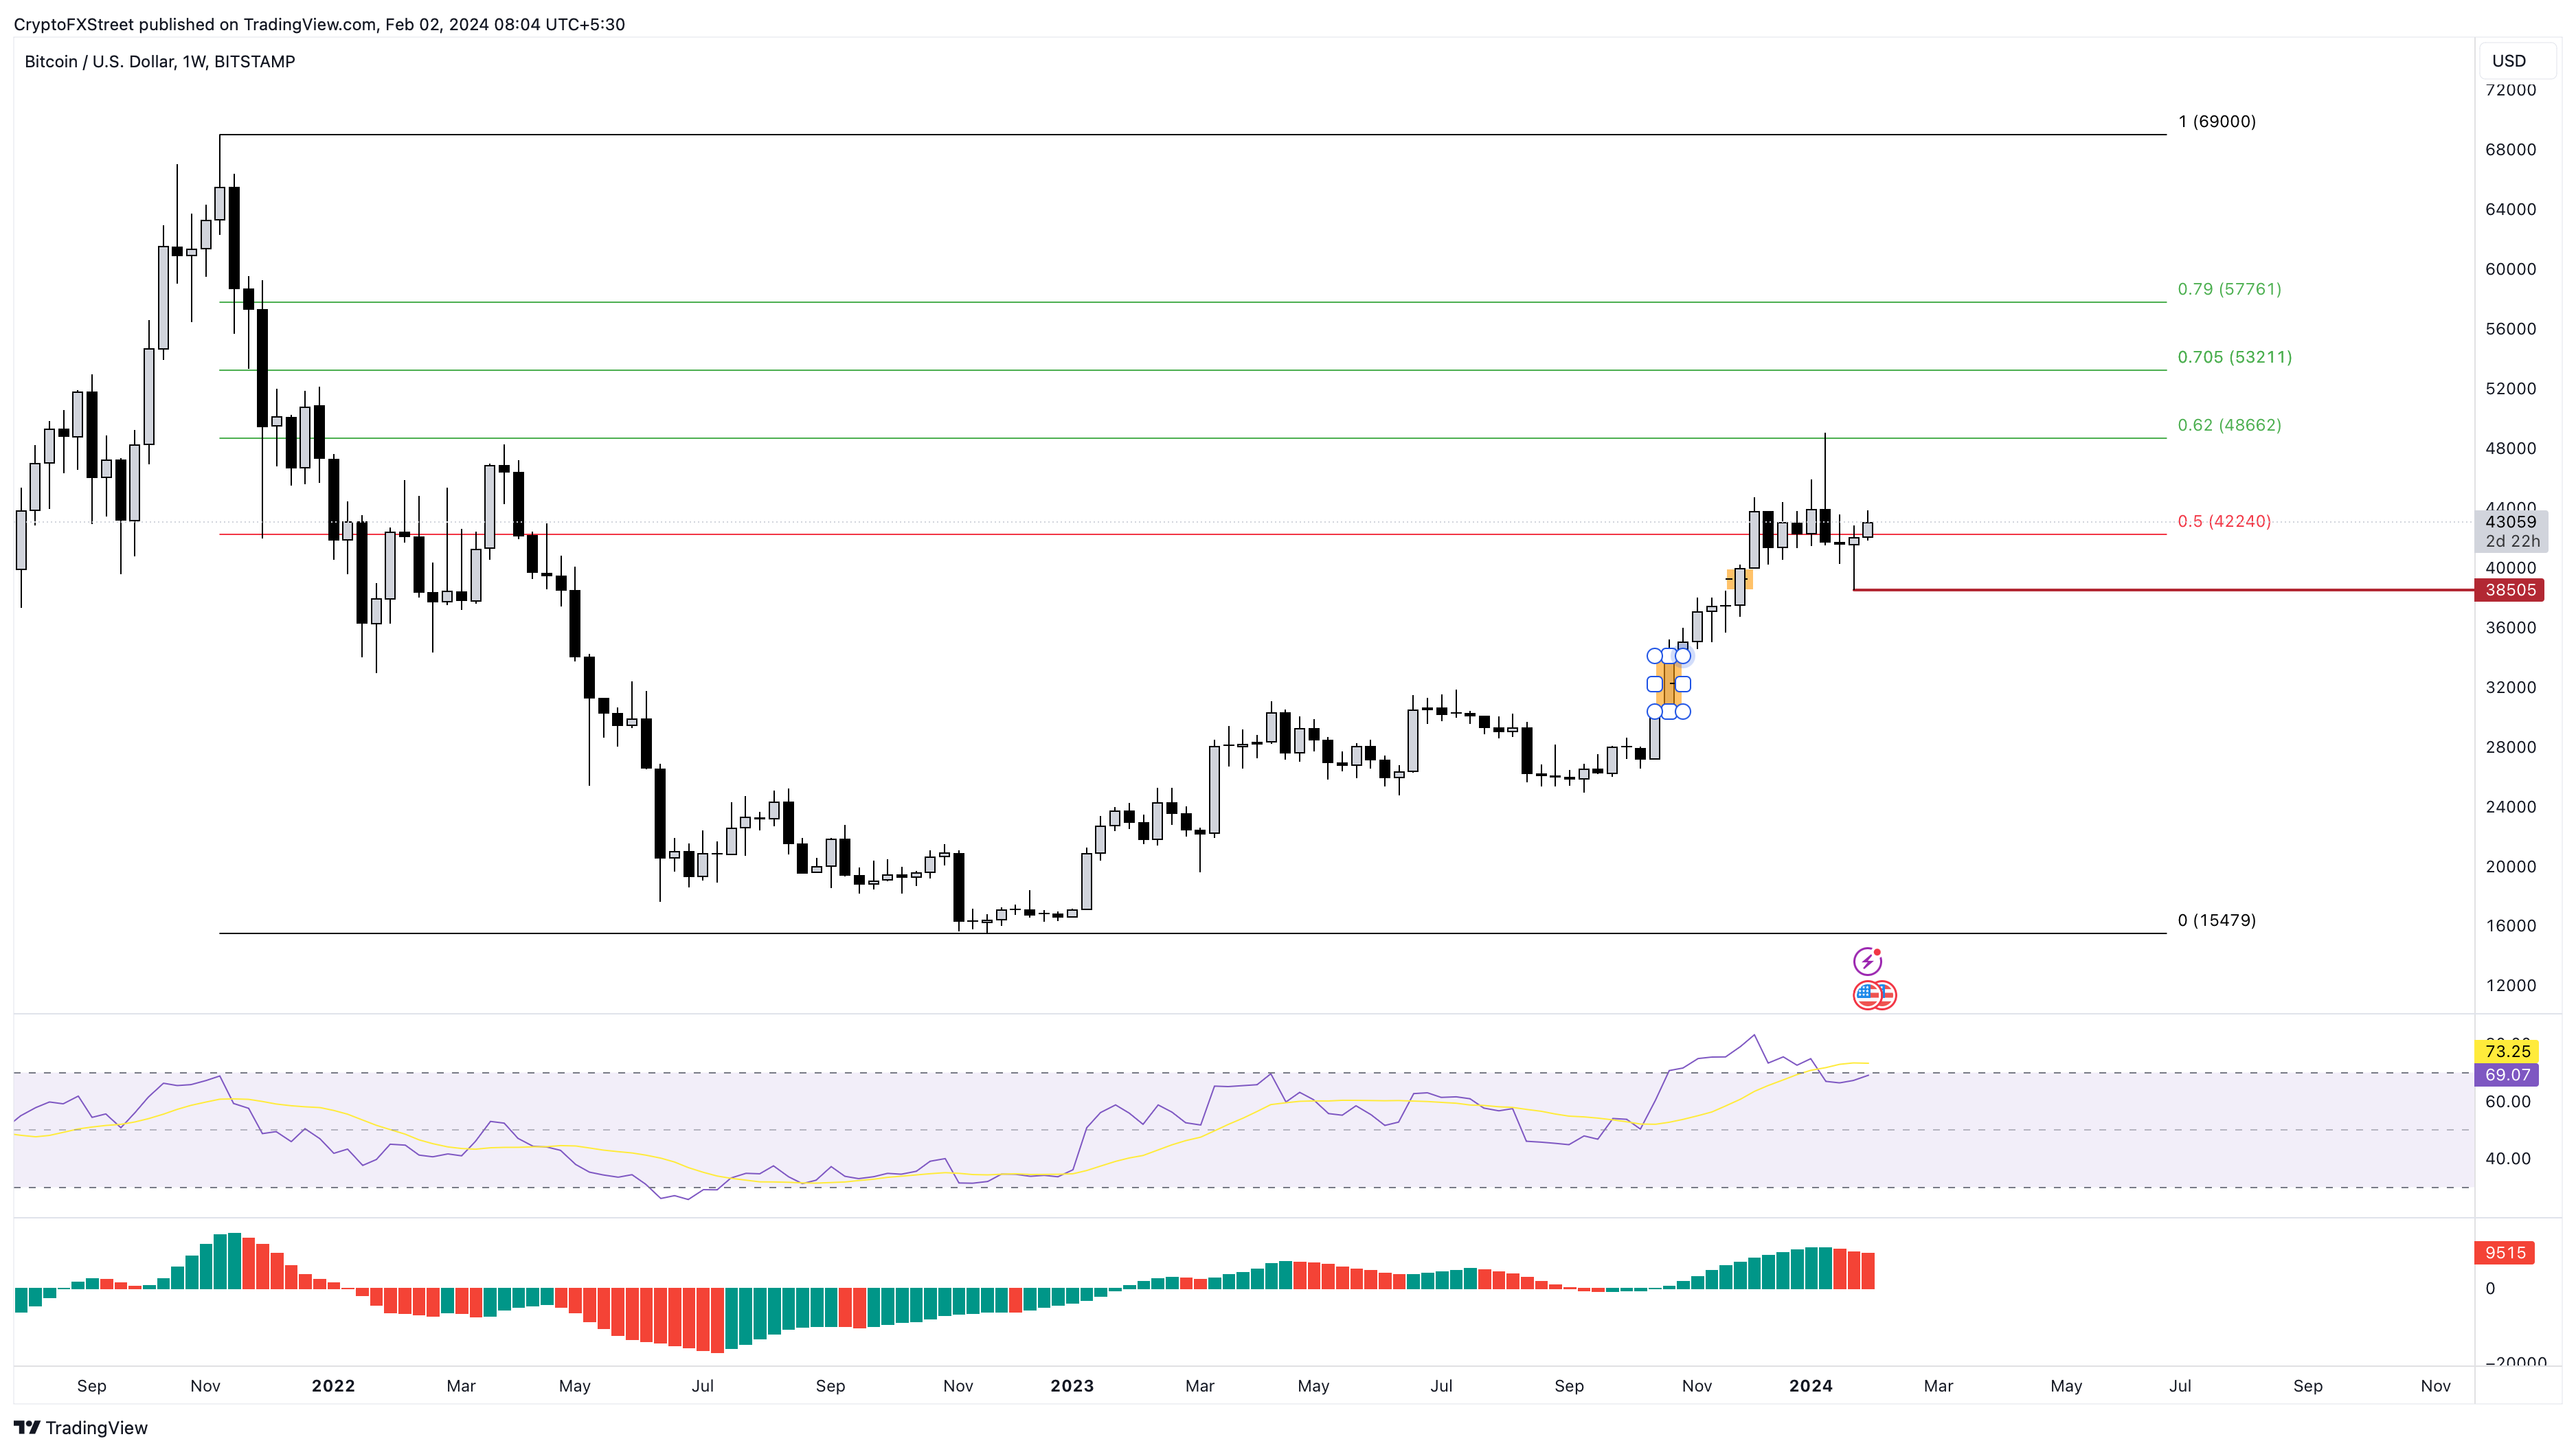
BTC/USDT 1-week chart
On the daily timeframe, however, things look different for Bitcoin price. This outlook calls for a dip into the daily imbalance, which extends from $41,396 to $40,278. This move would accomplish a few things – a sweep of Monday’s low, rebalancing of the imbalance, and dip into the low-volume node around the $40,400 region.
Depending on how Bitcoin price reacts at the $40,000 region, investors can decide to long BTC or sit on the sidelines. If there is a strong buying pressure that pushes the pioneer crypto to produce a higher high above $44,000, it would be a moderate buy signal. If this buying pressure manages to flip the $47,000 hurdle into a support floor, then investors can expect a retest of the $50,000 psychological level.

BTC/USDT 1-day chart
Also read: It may be time for Bitcoin traders to focus on John Bollinger's price bands again
BTC on-chain metrics reveal strong fundamentals
According to Santiment’s data, an interesting shift is occurring between holders with 100 to 1,000 BTC and 1,000 to 10,000 BTC. If investors take a look at the recent developments, the former cohort has been offloading, and their holdings have reduced by 3.81% from 3.93 million to 3.78 million between January 3 and February 2. However, the latter cohort has increased their stack by 2.34%, from 4.69 million to 4.80 million.
The 100 to 1,000 BTC cohort has shed 100,000 BTC in roughly a month, and the 1,000 to 10,000 BTC has added 110,000 BTC in the same period. While this development is bearish in the short term, investors need to widen their gaze. A closer look at the late 2019, 2020, and 2021 bull rally shows that the 1,000 to 10,000 BTC whales were the ones that accumulated before the price increase and were able to book profits at the top. Meanwhile, the 100 to 1,000 BTC whales were most likely buying as the price rallied.
All of these observations suggest that the 1,000 to 10,000 BTC is smart money. These whales have been accumulating since March 2023, and their holdings have shot up from 4.53 million BTC to 4.80 million BTC.
 [07.00.51, 02 Feb, 2024]-638424412918140113.png)
BTC Supply Distribution by Balance of Addresses.
Adding more information to the above indicator is the 365-day Market Value to Realized Value (MVRV) for Bitcoin price. This metric is used to determine the average profit or loss of investors who purchased BTC over the past year.
The 365-day MVRV has slashed in half in just two months, from 48% in December 2023 to 25%, to where it currently hovers. This means that the average unrealized profit of investors who purchased BTC over the past year has reduced from 48% to 25%, i.e., some of the investors have realized profits, which could be a reason for the sell-off.
This development coincides with the reduction in holdings of the 10 to 100 BTC cohort, as explained above.
In March 2023, the 365-day MVRV flipped above the zero line and has not fully reset to zero despite high unrealized profits. If this trend continues, Bitcoin price could most likely be done with corrections.
 [07.31.06, 02 Feb, 2024]-638424413105496938.png)
BTC 365-day MVRV
The supply of BTC held on exchanges is another key metric that provides insightful conclusions about investors' thinking. If BTC held on centralized platforms increases, it means that holders are not confident in Bitcoin price performance and are expecting to sell in case of a bad news event.
Currently, 1.06 million BTC sit on exchanges, a decline from a peak of 2.92 million seen in March 2020. To get a sense of how bullish the market is, investors need to note that this level was last seen in February 2018, when the total supply was hardly 17 million as opposed to the current 19.73 million BTC in circulation.
 [07.39.59, 02 Feb, 2024]-638424413300328619.png)
BTC Supply on Exchanges, Total Supply
To conclude, the on-chain metrics are showing bullish signs all the way. But the Bitcoin price remains indecisive in the short term. Investors looking to play the long game can mentally prepare to buy the dips at the current levels, but also be ready for corrections that could bring prices down to $34,000 and $30,000 levels.
Author

Akash Girimath
FXStreet
Akash Girimath is a Mechanical Engineer interested in the chaos of the financial markets. Trying to make sense of this convoluted yet fascinating space, he switched his engineering job to become a crypto reporter and analyst.