It may be time for Bitcoin traders to focus on John Bollinger's price bands again

Just over three months ago, an indicator called "Bollinger bandwidth" based on bitcoin's weekly price changes signaled a volatility boom. Sure enough, volatility picked up prior to the recent debut of spot BTC ETFs in the U.S.
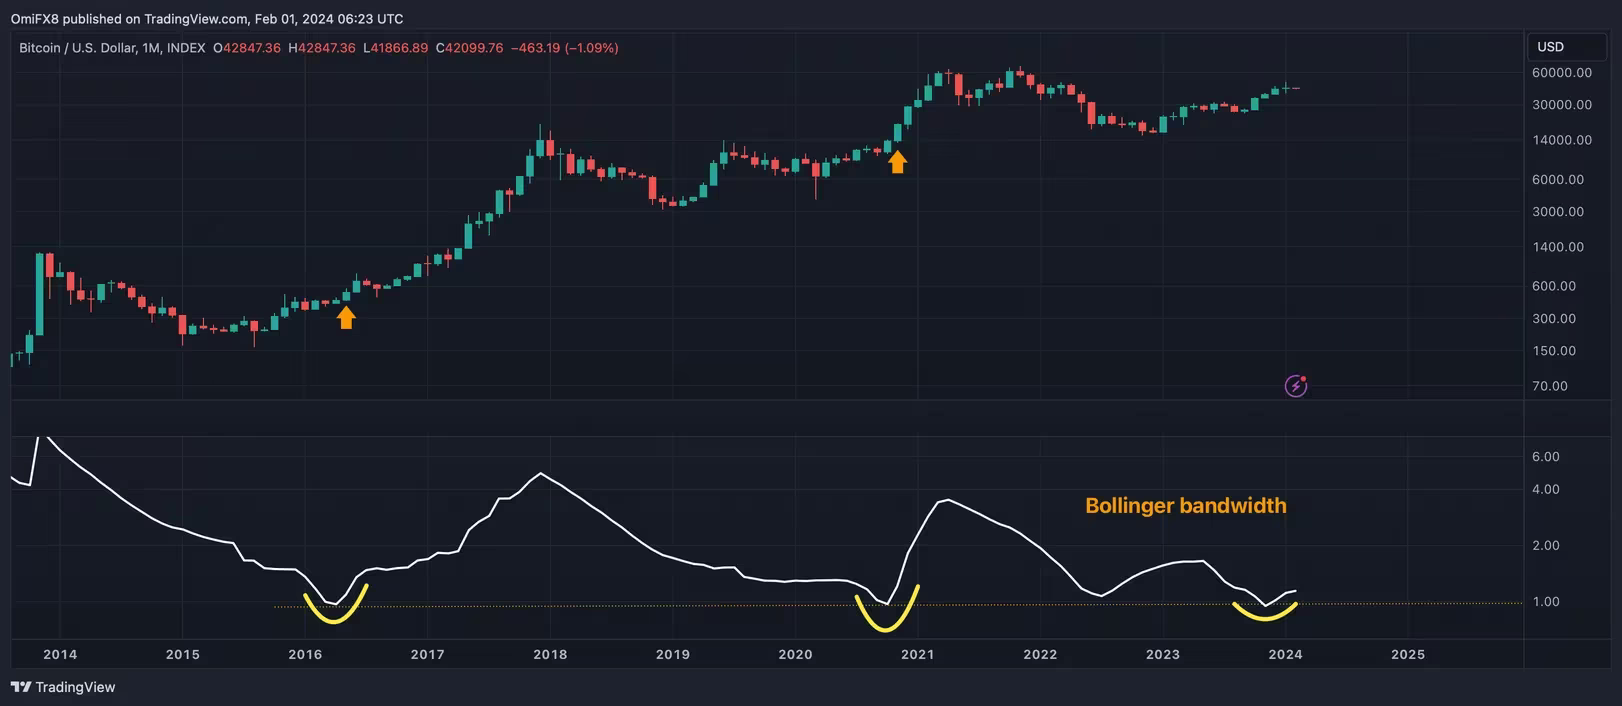
Now, the monthly chart Bollinger bandwidth has carved out a pattern that preluded Bitcoin's near-vertical rallies of 2016 and late 2020.
Created by John Bollinger in the 1980s, Bollinger Bands comprises three bands. The middle one is the 20-period simple moving average of the asset's price. The upper band is two standard deviations above the middle band and the lower band is two standard deviations below it.
The Bollinger bandwidth refers to the spread between upper and lower bands measured as the percentage of the moving average. A narrow width is akin to a tightly compressed spring about to make a big move in either direction.
Since inception, 1% has been a major low for Bitcoin's monthly chart Bollinger bandwidth, with subsequent upturns coinciding with prolonged price rallies or bouts of upside volatility.
(TradingView/CoinDesk)
The bandwidth has recently bounced from 1% in a positive development for bitcoin bulls.
Though the latest bandwidth pattern resembles developments before previous bull runs, the indicator, by itself, only signals that a major price move is due but doesn't tell us anything about the direction.
In other words, past results do not guarantee future performance, and the possibility of a large move to the downside cannot be ruled out.
That said, most analysts are bullish on the cryptocurrency, expecting the recently launched spot ETFs to accelerate adoption and lift prices to new record highs above $69,000 in the next 12 months
Author

CoinDesk Analysis Team
CoinDesk
CoinDesk is the media platform for the next generation of investors exploring how cryptocurrencies and digital assets are contributing to the evolution of the global financial system.




