Bitcoin price scenarios to consider with approaching BTC halving event
- Bitcoin halving is less than 90 days away, and traders can anticipate a post-halving correction of 7% to 30% within a month.
- Bitcoin price could hit its market top between April and October 2025 if BTC follows historical trends from previous halvings.
- BTC on-chain metrics signal a buy-the-dip opportunity for traders.

Bitcoin (BTC) trades sideways around $42,000 on Thursday, recovering slightly from the $42,276 low seen on Wednesday after US Federal Reserve Chair Jerome Powell said that inflation is “still too high” and a March rate cut is not likely.
Market participants are likely anxious since the Fed has currently revealed no immediate plans to ease its monetary policy. In that case, BTC and risk assets could see an increase in capital outflows.
Powell’s comments, along with the anticipation surrounding the upcoming halving event and BTC on-chain metrics, are the key drivers of Bitcoin price in the short term. That said, on-chain metrics paint a short-term bullish picture for BTC price, ahead of the pre-halving “sell the news” effect expected from similar events in the past.
Daily digest market movers: Bitcoin dips in response to Fed’s policy meeting
- Bitcoin price slightly dipped on Wednesday after Fed Chair Powell noted that he doesn’t see a rate cut in March.
- Bitcoin hit a low of $42,276 on Wednesday and slightly recovered to a high of $42,687 early on Thursday.
- Bitcoin’s halving event is 88 days away, according to Nicehash countdown. This is considered a major catalyst for Bitcoin price.
- As seen in previous halving events, BTC price dips immediately post-halving, wiping out between 7% and 30% of Bitcoin’s value within a month.
- BTC price then rallies to a market top in the cycle, which typically occurs within 12 to 18 months after the halving event.
- If history repeats itself, BTC price could crash within 30 days after the halving, (between April and May 2024) and hit its market top between April and October of 2025. Post the BTC halvings in 2012, 2016, and 2020, BTC price surged by 11,000%, 2,850%, and 700%, respectively.
- On-chain metrics are signaling a buy signal for Bitcoin. The Market Value to Realized Value ratio (MVRV), used to ascertain the average profit or loss of traders in a given time period, indicates that it is a time for traders to “buy the dip” in Bitcoin.
- As seen in the Santiment chart below, every time the 30-day MVRV dips below the 90-day MVRV ratio, the asset’s price rallies within a week or 10 days. This has happened between January 22 and 25, suggesting that BTC is in a “buy the dip” window that could yield short-term gains for holders.
 [10.20.42, 01 Feb, 2024]-638423661211153858.png)
Bitcoin MVRV ratio 30-day and 90-day. Source: Santiment
- Another key on-chain metric, BTC exchange supply, has been declining since May 1, 2023. The gradual decrease in Bitcoin’s exchange reserves tends to reduce the selling pressure on the asset and make way for potential BTC price gains. The recent spikes in the exchange flow balance represent outflows from exchange wallets, meaning traders are likely pulling BTC off exchanges and therefore holding on to their BTC instead of taking profits.
 [10.36.18, 01 Feb, 2024]-638423661648284032.png)
Bitcoin supply on exchanges and exchange flow balance. Source: Santiment
- Bitcoin’s sideways price action over the past week has paved the way for altcoin price rallies. BTC price is currently key to sustaining the rallies of top altcoins. To find out more about altcoin narratives and BTC price targets based on an analysis of the past three halvings, check this out.
Technical Analysis: Bitcoin price dips with expectation of no rate cut in March
Bitcoin price has sustained above the $42,000 level on Thursday despite the slight decline on Wednesday. BTC has failed to breach the resistance at the lower boundary of the bearish imbalance zone between $43,904 and $45,597. BTC price is expected to continue trading sideways until it breaches the resistance.
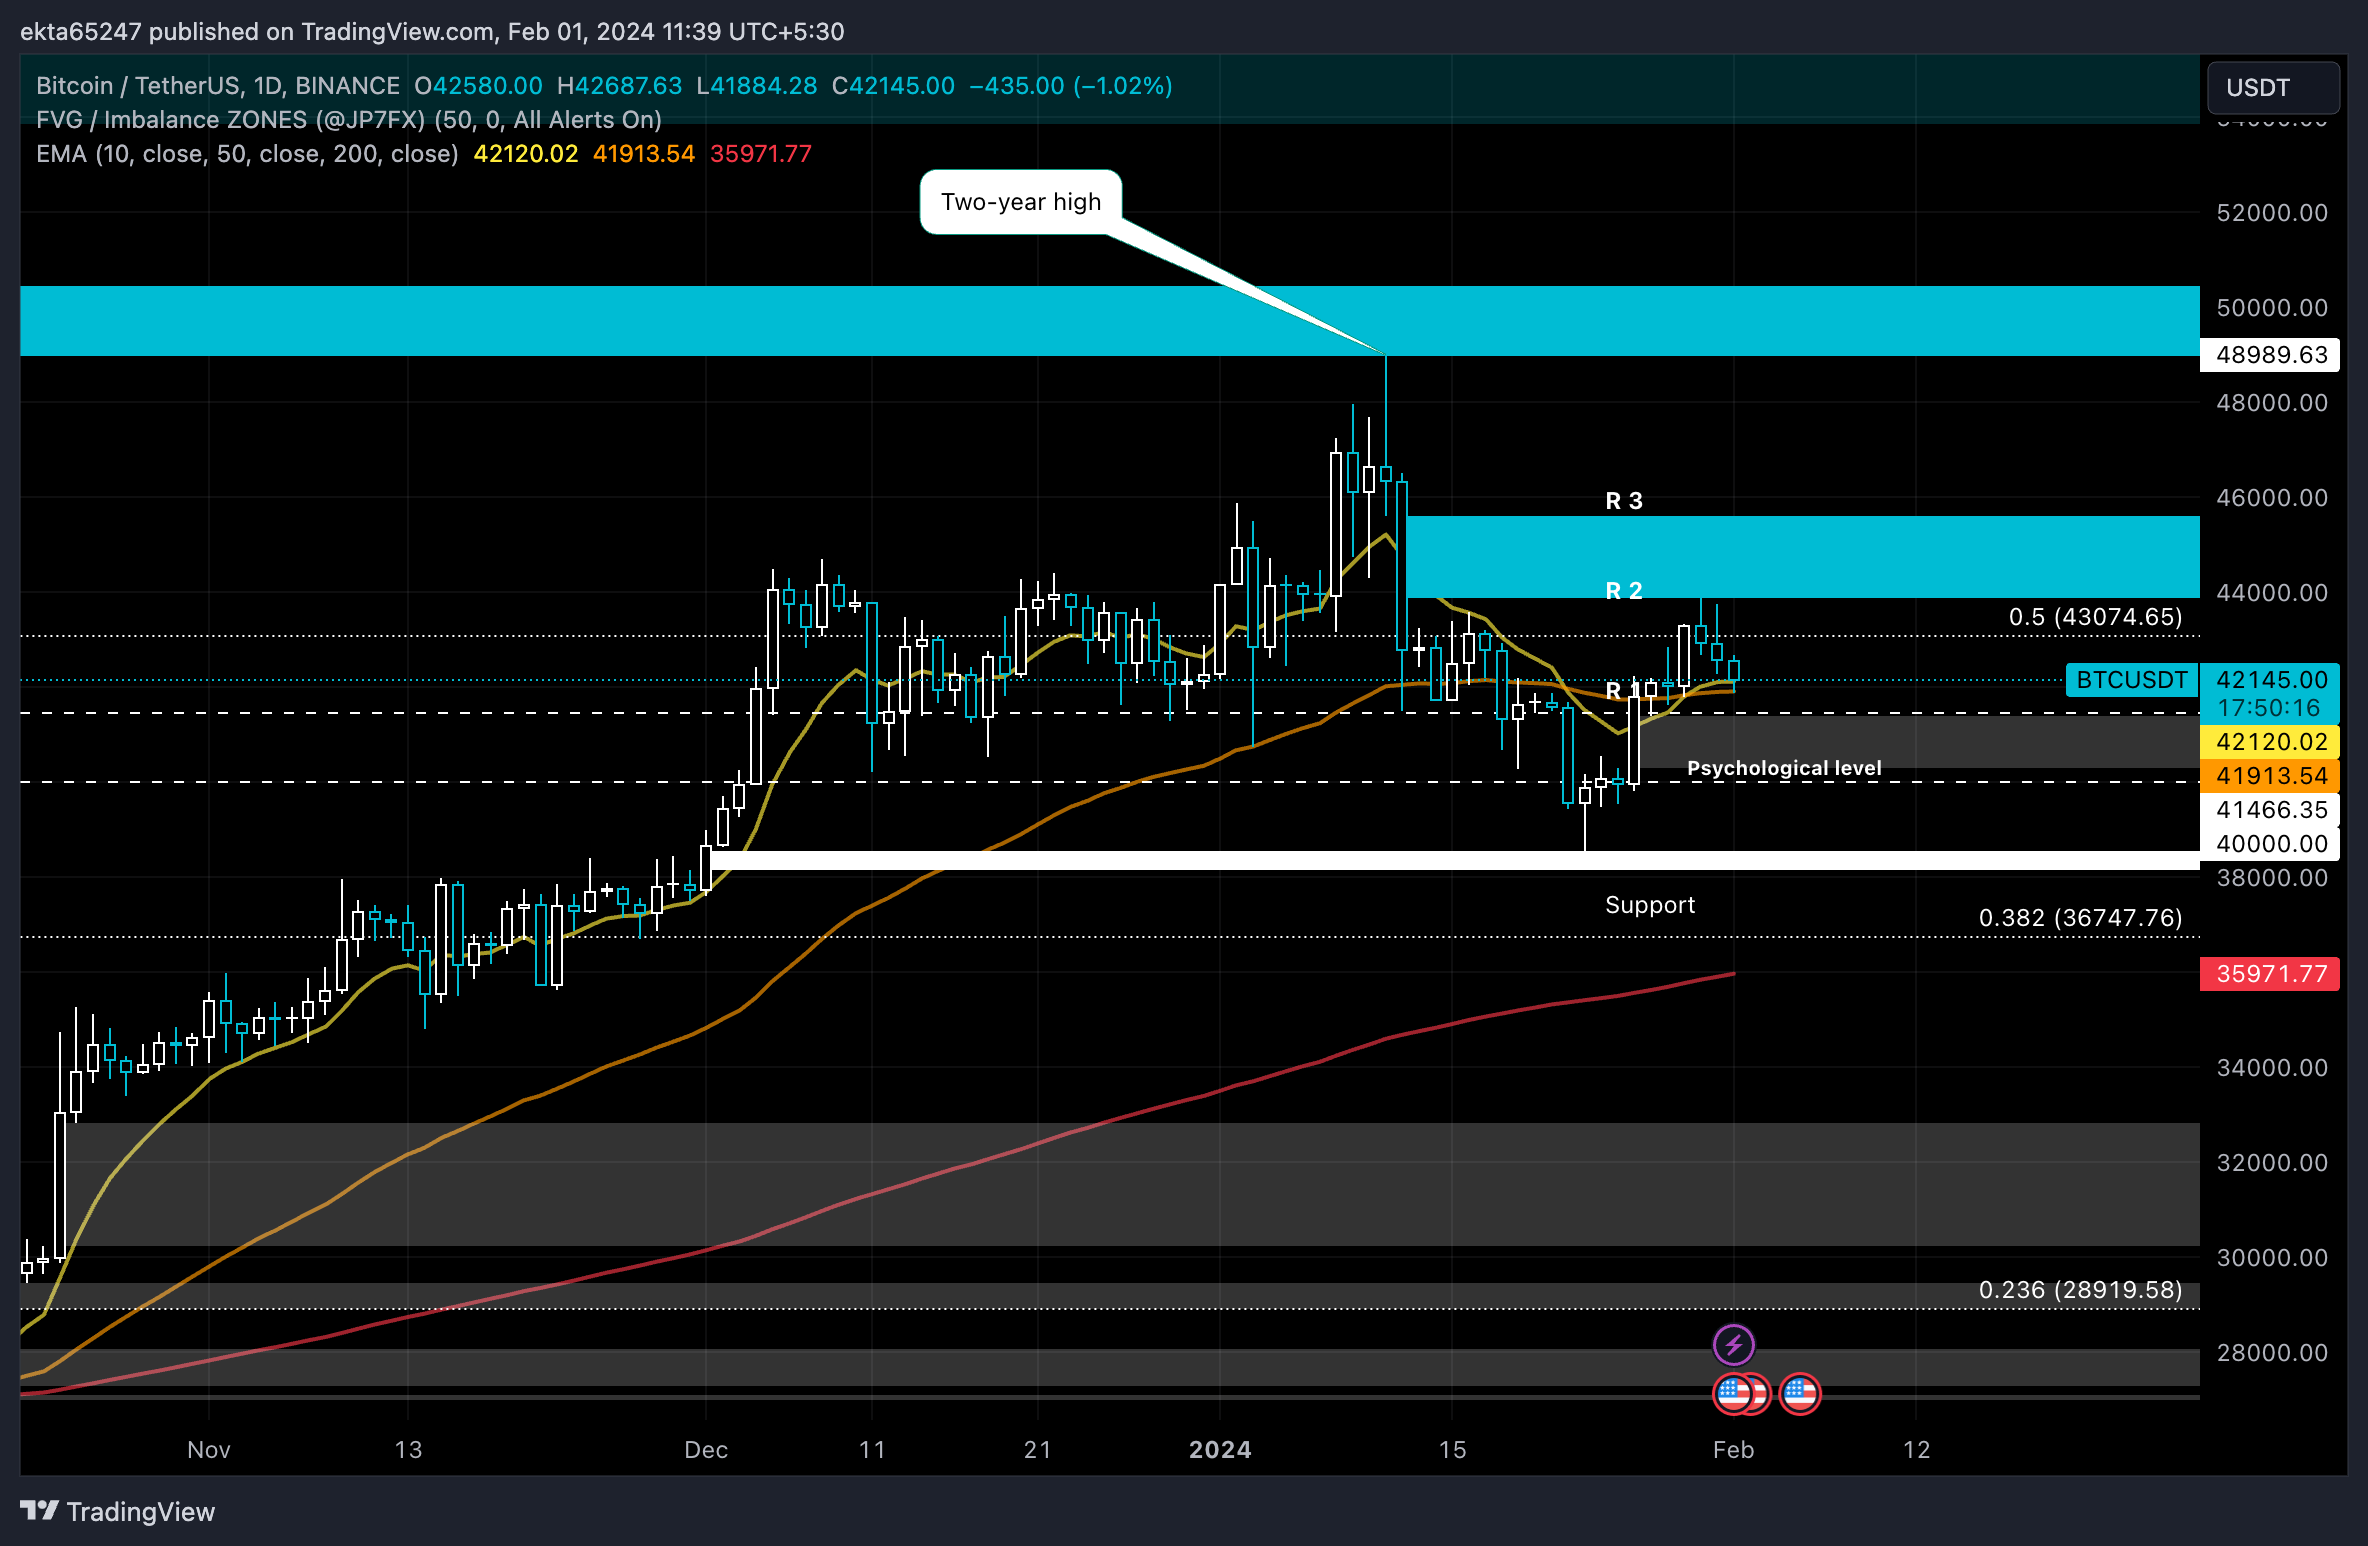
BTC/USDT 1-day chart
The Relative Strength Index (RSI) is at 49.33, close to the mean level, signaling indecisiveness ahead. However, the histogram bars of the Awesome Oscillator (AO) are flashing green, signaling that bulls are likely in control. If there is a sustained increase in buying pressure on BTC, the asset could flip the resistance at $43,904 into support and extend past the upper boundary of the imbalance zone at $45,597. In a bullish case, BTC price could extend above its two-year high at $48,989, inching closer to the $50,000 target.
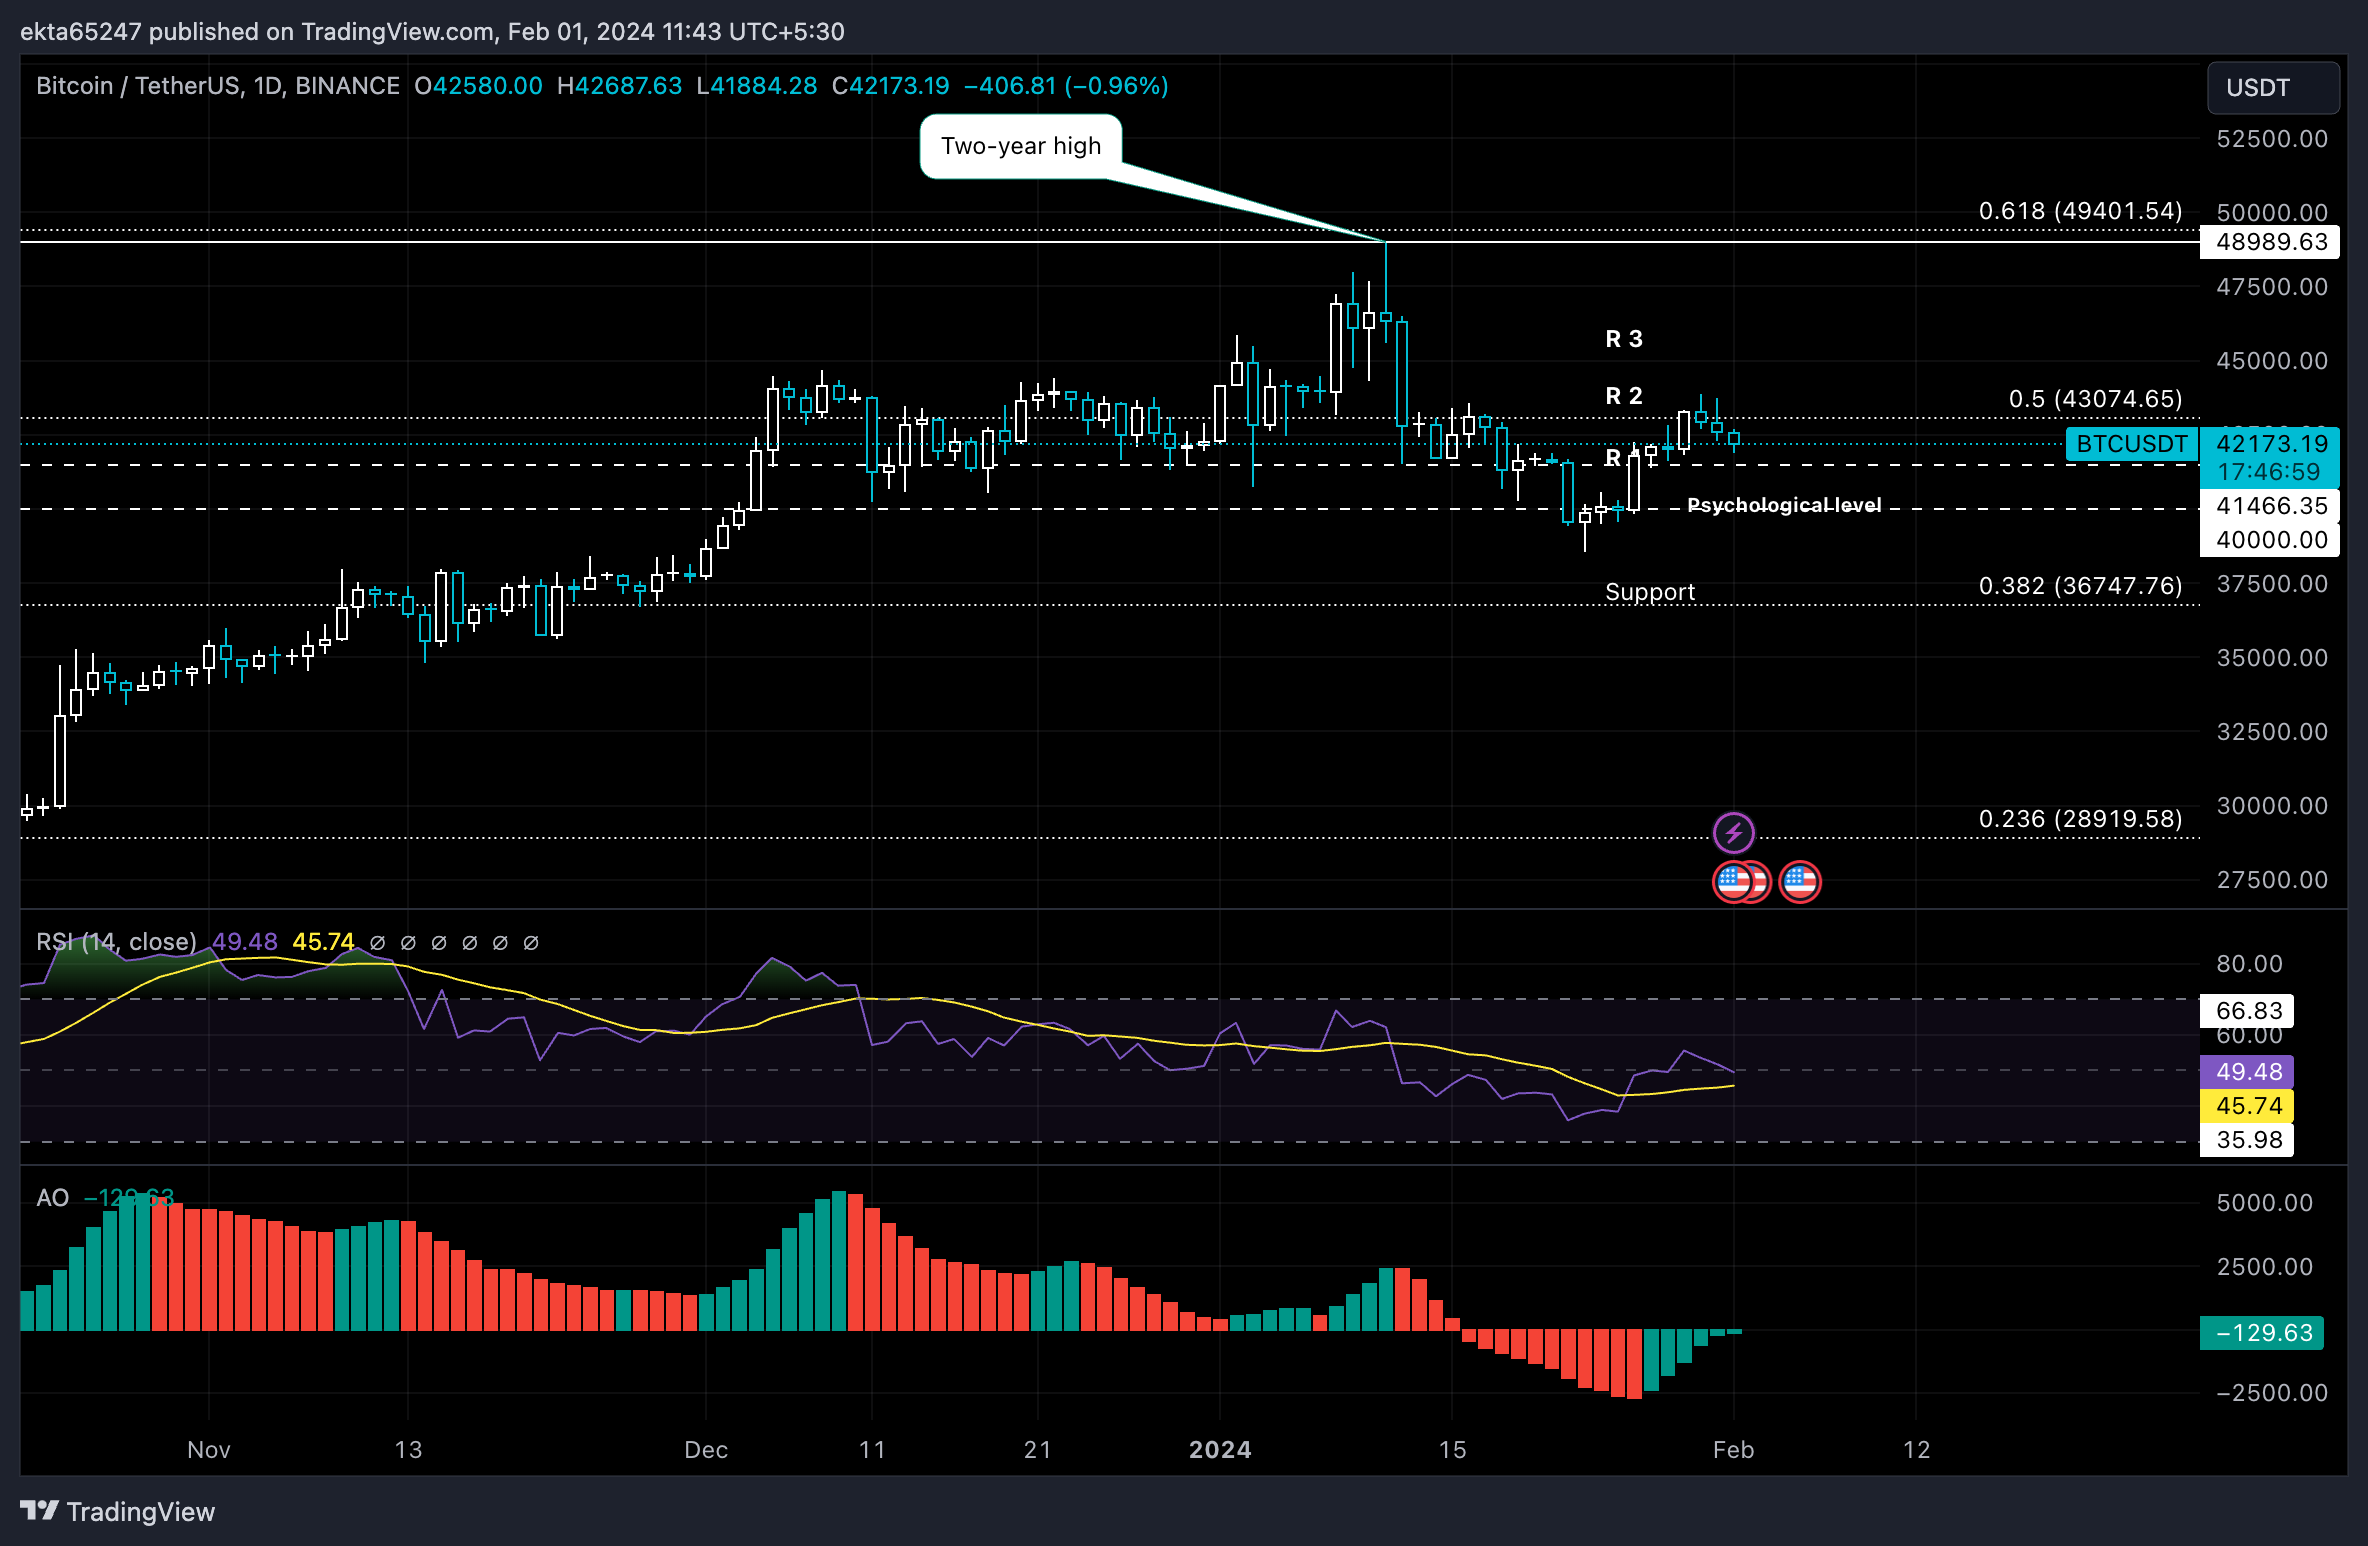
BTC/USDT 1-day chart
A daily candlestick close below the support at $41,466 could invalidate the bullish thesis for BTC. In the event of a price correction, BTC price could slip to the psychological support level at $40,000.
Open Interest, funding rate FAQs
How does Open Interest affect cryptocurrency prices?
Higher Open Interest is associated with higher liquidity and new capital inflow to the market. This is considered the equivalent of increase in efficiency and the ongoing trend continues. When Open Interest decreases, it is considered a sign of liquidation in the market, investors are leaving and the overall demand for an asset is on a decline, fueling a bearish sentiment among investors.
How does Funding rate affect cryptocurrency prices?
Funding fees bridge the difference between spot prices and prices of futures contracts of an asset by increasing liquidation risks faced by traders. A consistently high and positive funding rate implies there is a bullish sentiment among market participants and there is an expectation of a price hike. A consistently negative funding rate for an asset implies a bearish sentiment, indicating that traders expect the cryptocurrency’s price to fall and a bearish trend reversal is likely to occur.
Author

Ekta Mourya
FXStreet
Ekta Mourya has extensive experience in fundamental and on-chain analysis, particularly focused on impact of macroeconomics and central bank policies on cryptocurrencies.


