Bitcoin price rekindles hope for $50,000 target as spot BTC trading volumes hit the roof
- Bitcoin price tumbled from a daily high above $48,900 after spot BTC ETF trading began on Thursday.
- Soaring trading volumes reach millions of Dollars in minutes and billions of Dollars within the hour.
- BTC could rise 9% to the $50,000 psychological level, a level last tested in December 2021.
- The bullish thesis would be invalidated if the price closes below the $43,916 weekly mean threshold.

Bitcoin (BTC) price’s immediate response to the spot exchange-traded funds (ETFs) approval was a 2% correction as traders cashed in on the sell-the-news situation. The turnout quelled anticipation for the $50,000 target, but the optimism is coming back as the spot BTC ETFs have turned out to be a bullish fundamental after all.
Also Read: Spot BTC ETFs approached $2 billion in trading volume within an hour of trading after SEC approvals
Bitcoin spot ETFs trading volumes skyrocket
Minutes after spot BTC ETFs went live, their trading volumes skyrocketed, recording millions of dollars in minutes and billions of dollars in hours. ETF specialist Eric Balchunas said the numbers were “UNREAL” for the first day of trading, let alone hours.
Specifically, with only ten spot bitcoin ETFs already live, over $1.3 billion in trading volume has been recorded on Thursday. Factor in Grayscale’s GBTC and the numbers fly to $2.3 billion. This figure rises to $3.5 billion if ProShare’s BITO, which is not in the spot race, is factored in.
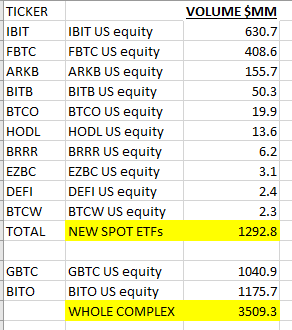
Spot BTC ETF volumes
ETF specialist James Seyffart articulated that the trading volumes crossed the $1.2 billion trading volume mark within the first half hour after trading started. Notably, the volume points to buying, save for GBTC and BITO.
Re what all these dollars flying around means. For the 10 fresh ETFs volume = buying btc today. Clear cut. But, GBTC volume prob ALL selling and maybe $BITO has some too so likely a lot offsetting going on. Just my take tho, not 100%, we'll know more when flows hit tonight
— Eric Balchunas (@EricBalchunas) January 11, 2024
Based on the leaderboard, Grayscale’s GBTC is leading with $446 million, followed by the IBIT from iShares Bitcoin Trust with $388 million. Fidelity’s FBTC is in third place with $230 million, while Cathie Wood’s Ark 21Shares records $82 million as of the time of writing.
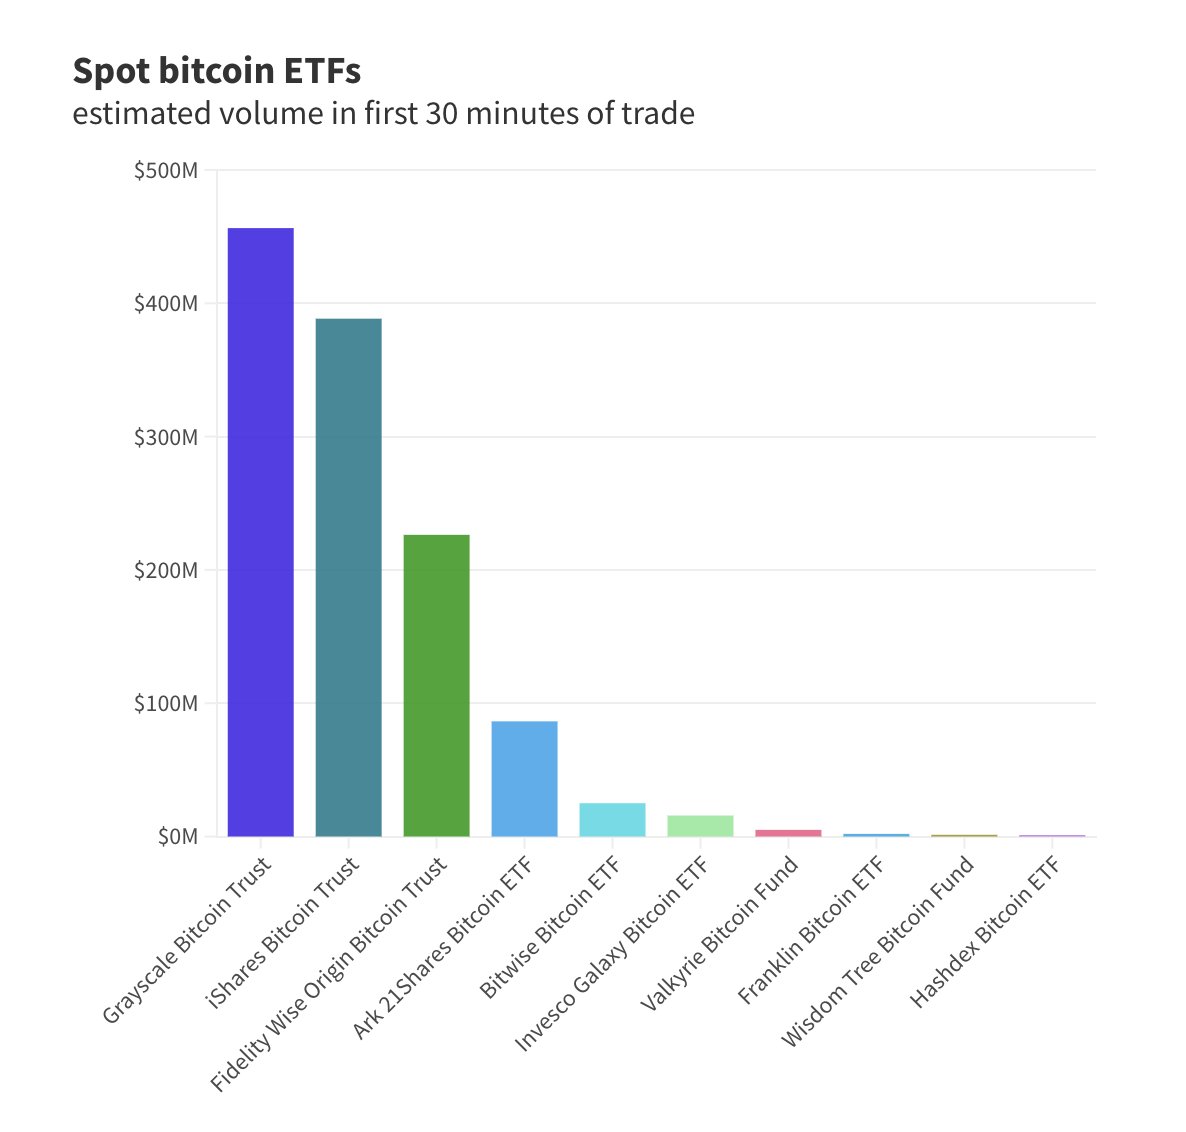
Spot BTC ETF trading volume leaderboard
With the trading volumes hitting the roof, hope for Bitcoin price hitting $50,000 is rekindled, despite assumptions that the purchases are over the counter.
According to CryptoQuant, Coinbase’s BTC OTC trading volume reached $7.7 billion today, reaching the second highest level in history. This means that the purchase of BTC through OTC transactions may be related to the passage of the spot BTC ETF. Crypto exchange BTC daily trading… pic.twitter.com/1zX31aJkqh
— Wu Blockchain (@WuBlockchain) January 11, 2024
Notably, OTC purchases happen away from exchanges. Theoretically, they should not affect Bitcoin price. Nevertheless, the presence of large buyers (or sellers) making inquiries in the OTC market, is likely to be leaked, such that word spreads. This leaked information should see to it that the price on exchanges is also affected. This explains the fluctuations in Bitcoin price while pointing to demand pressure.
Bitcoin price outlook as $50,000 becomes attainable again
On the four-hour timeframe, Bitcoin price is consolidating within an ascending parallel channel, with the reaction to spot BTC ETF trading and the US CPI inflation reading sending BTC above $48,000, recording an intra-day high of $48,969.
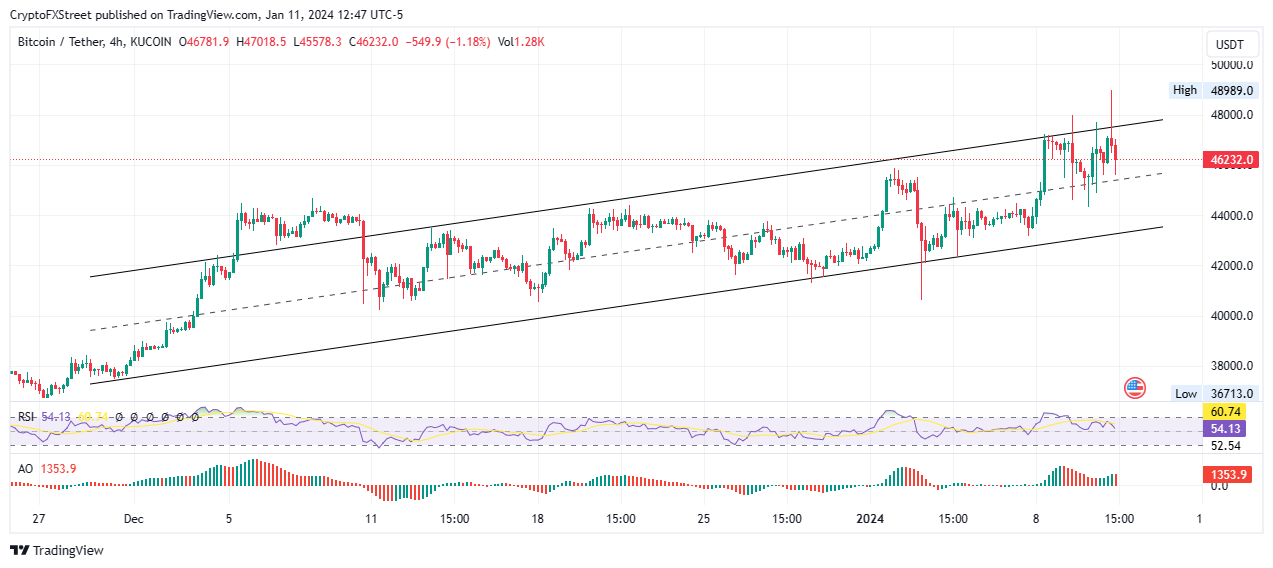
BTC.USDT 4-hour chart
On the daily timeframe, Bitcoin price is trading within the weekly supply zone extending between $40,467 and $46,999. To confirm the continuation of the trend, BTC must flip this order block into a bullish breaker, confirmed by a break and close above the $48,000 psychological level.
Increased buying pressure above current levels could see Bitcoin price extend north to clear the range high at 48,969. In a highly bullish case, the gains could extrapolate for the king of cryptocurrency to complete the 9% climb to the $50,000 psychological level.
The position of the Relative Strength Index (RSI) above the 50 midline points to a strong price strength. Its stance at 60 shows there is still more room to the north. In the same way, the Awesome Oscillator (AO) is in positive territory, suggesting the bulls maintain a strong presence in the big picture BTC market. This evidence favors the upside.
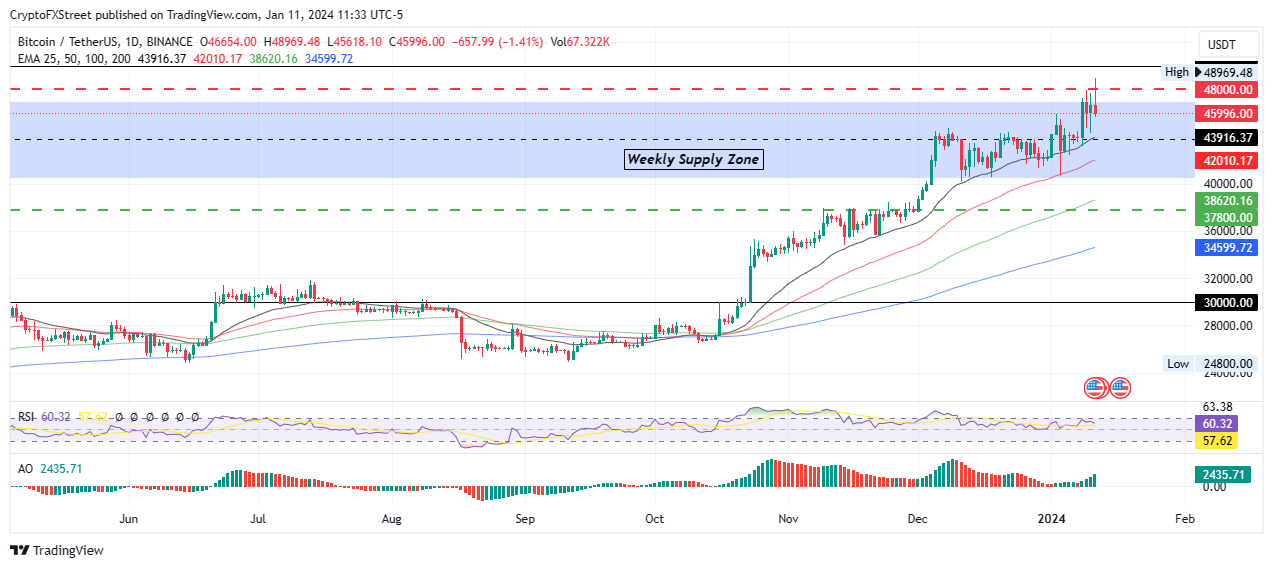
BTC/USDT 1-day chart
Conversely, if selling pressure increases, Bitcoin price could descend, testing the confluence between the midline of the weekly supply zone at $43,916 and the 25-day Exponential Moving Average (EMA). An extended fall could see BTC find support due to the 50-day EMA at $42,010. If these buyer congestion levels fail to hold as support, BTC could spiral out of the supply barrier to test the 100-day EMA, or lower, the critical support at $37,800.
Rolling over past $37,800 would see Bitcoin price hit a cliff, potentially descending to the 200-day EMA at $34,599.
Author

Lockridge Okoth
FXStreet
Lockridge is a believer in the transformative power of crypto and the blockchain industry.




