Bitcoin Price Forecast: Bitcoin currently negotiating with the $10,960 resistance line – Confluence Detector
- BTC is presently consolidating in an ascending triangle formation.
- Daily confluence detector shows healthy support down at $10,600.

BTC/USD is trending in an ascending triangle formation as price consolidates below $11,000. The price has been trending horizontally for the last three days, as evidenced by the 20-day Bollinger band's constriction, which indicates lower volatility. Currently, BTC is hugging along the $10,960 resistance line.
BTC/USD daily chart
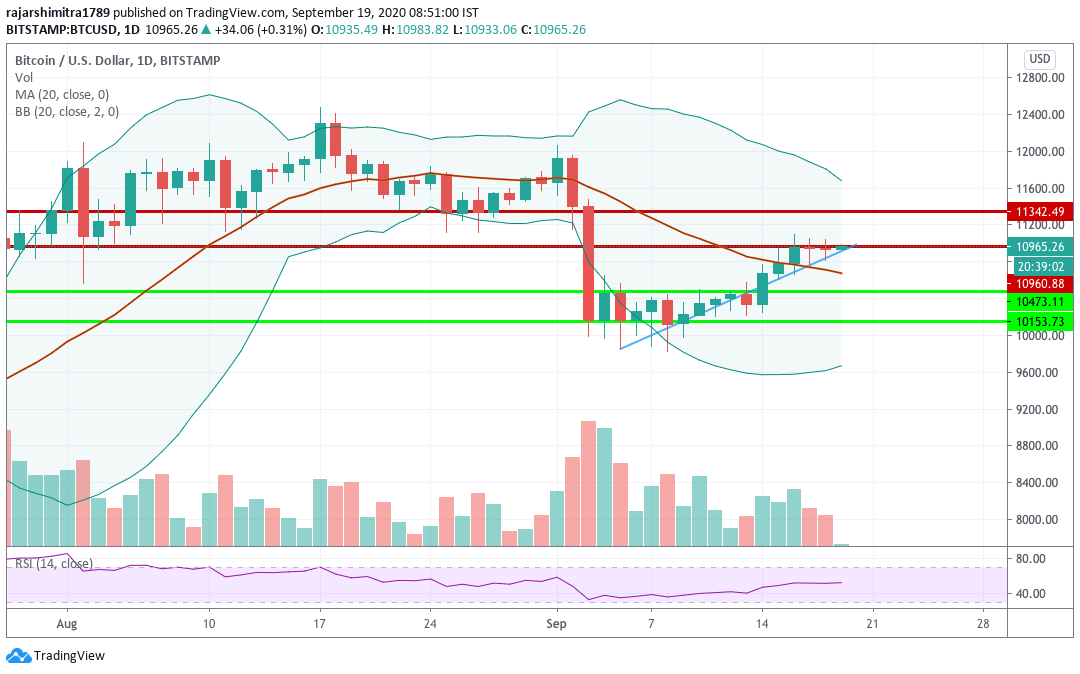
If the price breaks above that, they will want to go up to the $11,350 resistance line. The RSI is trending along the neutral zone so it is still anybody’s ball game.
BTC daily confluence detector
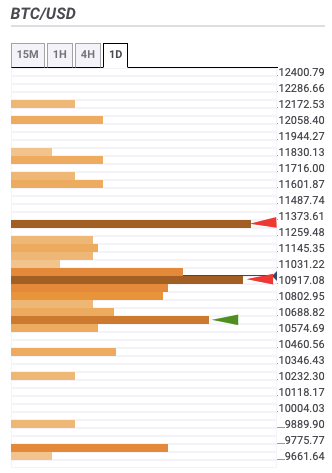
The daily confluence detector makes for pretty much the same reading. Currently, the price is stifled under the $10,960 resistance line, which has the one-week Fibonacci 23.6% retracement level. Up next, we have another strong resistance at $11,300, which has the one-day SMA 50, daily Pivot Point one resistance-three, weekly Pivot Point one resistance-one and the one-month Fibonacci 61.8% retracement level.
On the downside, we have a support level at $10,600, which has the Previous Month low and daily Pivot Point one support-three.
Author

Rajarshi Mitra
Independent Analyst
Rajarshi entered the blockchain space in 2016. He is a blockchain researcher who has worked for Blockgeeks and has done research work for several ICOs. He gets regularly invited to give talks on the blockchain technology and cryptocurrencies.


