Bitcoin Weekly Forecast: BTC crystal ball gives bulls a faint flicker of hope
- The short-term technical signals imply that BTC is ripe for downside correction.
- Strong support will prevent the Bitcoin price from a free fall.
- The longer-term risks are tilted to the downside.

Bitcoin staged a healthy recovery this week. The pioneer digital currency price took off from the support area of $10,000 and touched the next psychological line of $11,000. At the time of writing, BTC/USD is changing hands at $10,940, mostly unchanged in the last two days.
Bears are ready to snatch the initiative
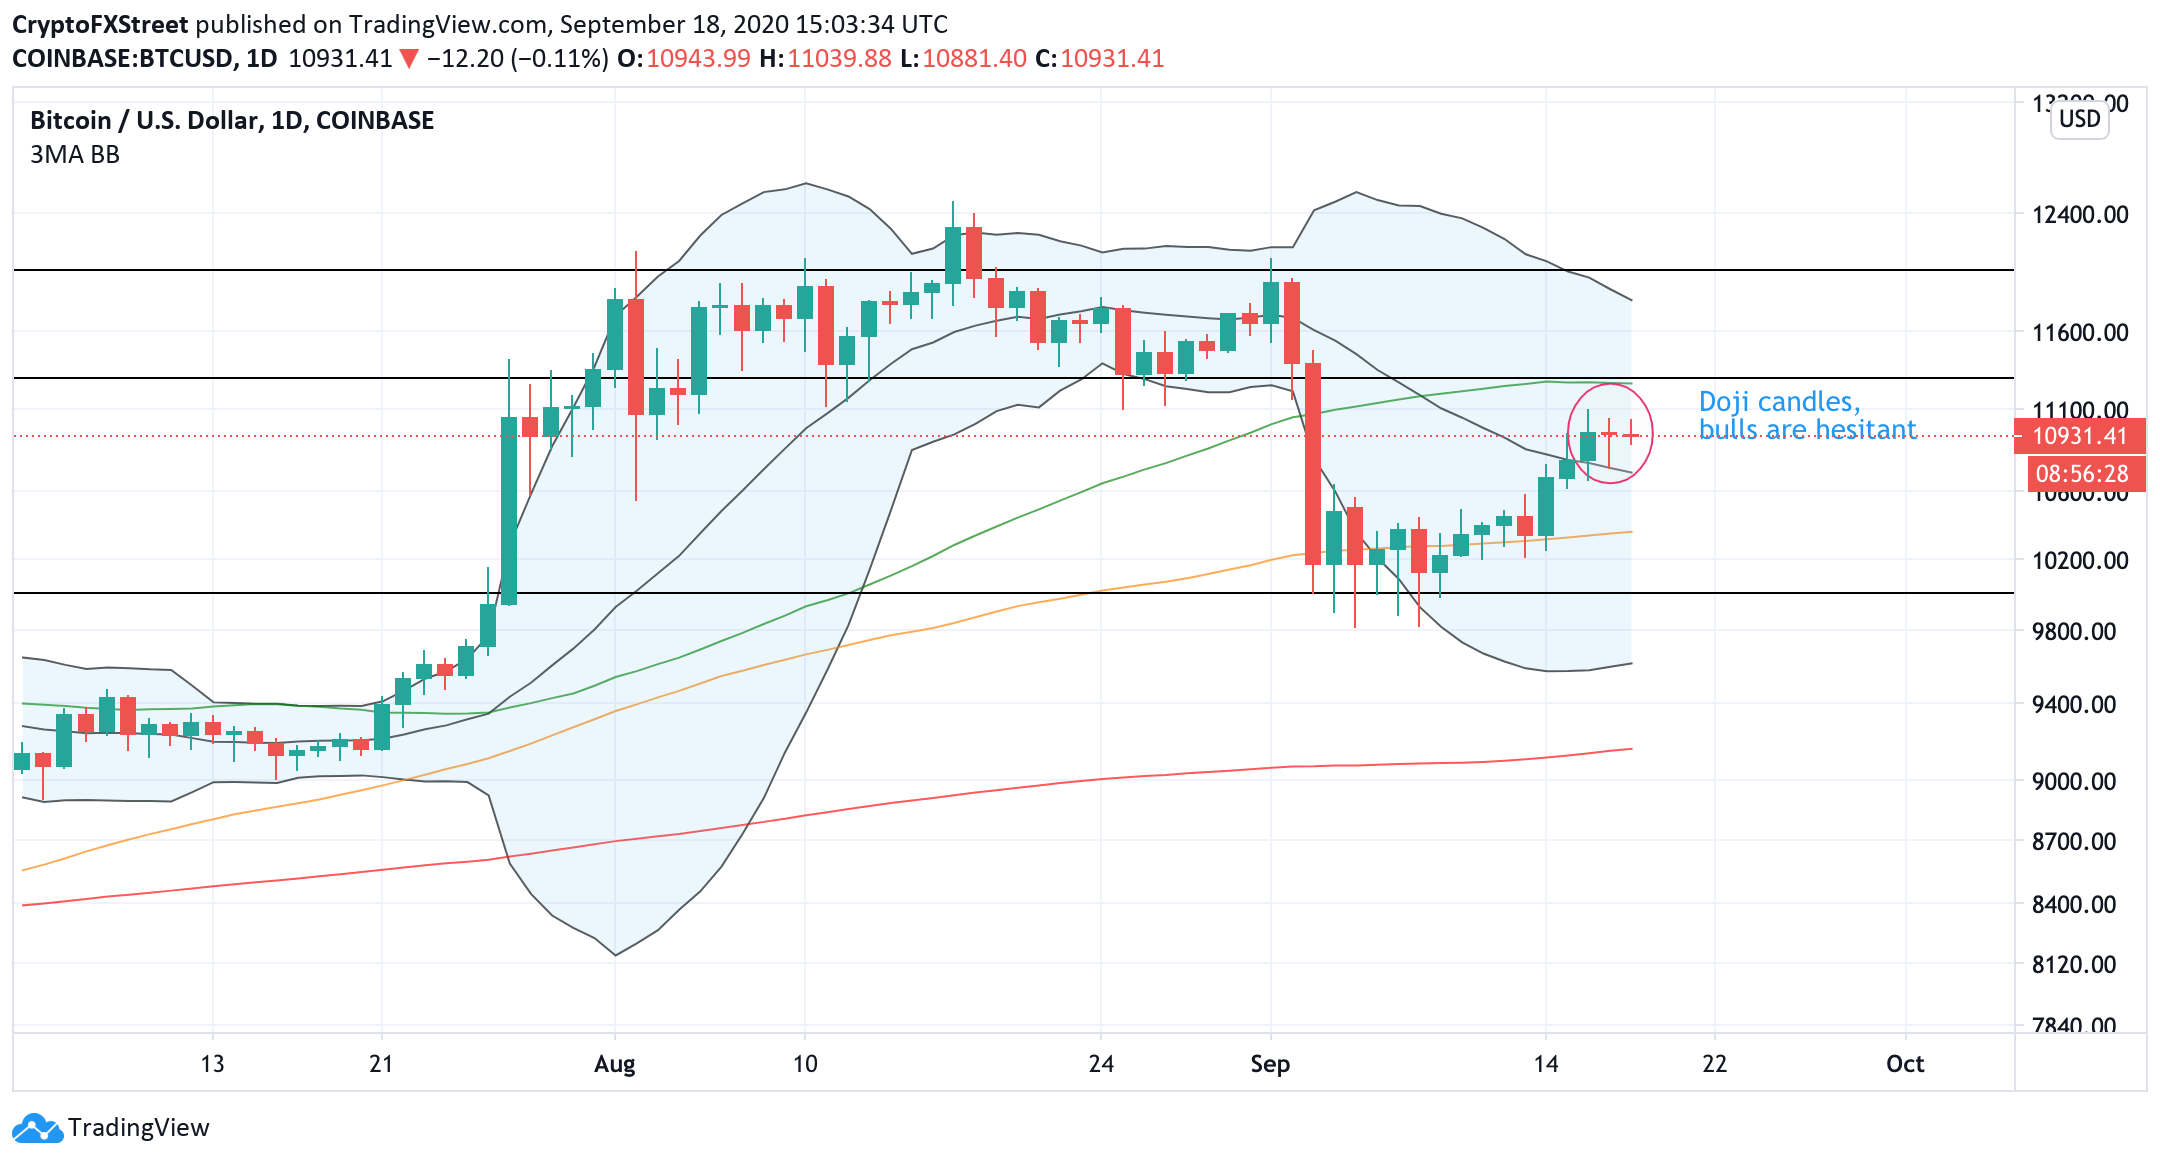
From the technical point of view, the strong resistance comes at $11,300. This barrier served as strong support for BTC in August and flipped into resistance after a sharp sell-off in September's first week. Notably, this line is also reinforced by the daily SMA50; however, the bullish interest petered out on approach to the psychological barrier of $11,000, meaning that the market is gripped by indecision at this stage.
Two Doji candles following a steep growth on a daily chart confirm the high level of uncertainty and imply that bears may be ready to snatch back the initiative if bulls stay hesitant and fail to pass the resistance area of $11,000-$11,300 any time soon.
Meanwhile, the TD index on daily and 12-hour charts send sell signals, worsening the short-term technical picture. This setup, combined with the strong resistance ahead, implies that BTC price is at risk to retreat to $10,500 or even $10,000 before bulls decide on a recovery attempt.
BTC/USD daily chart
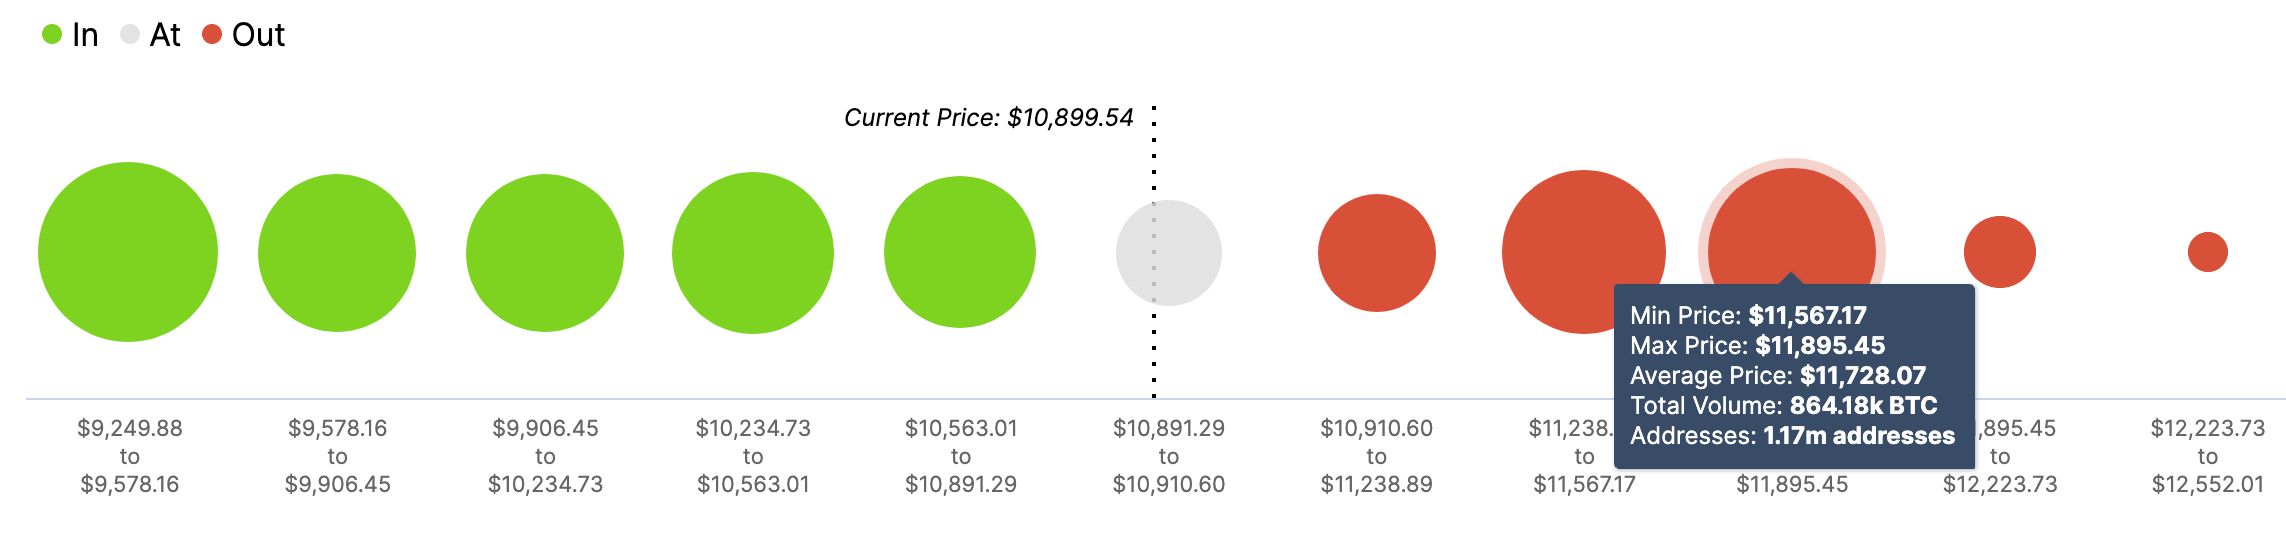
A closer look at the market positioning reveals that the biggest wall of supply comes at $11,600-$11,900. One million addresses with over 700k BTC have their breakeven point within that area. However, there are also smaller, but still significant barriers on approach to $11,300 and $11,600, meaning that BTC bulls will need some right motivation and persistence to plow through.
Bitcoin's market positioning data: Not so fast, please
Source: Intotheblock
On the other hand, we have two significant clusters of BTC addresses with 760k and 770k BTC with the breakeven in the range from $10,900 all the way down to $10,200, making the way to the South even harder than the potential recovery.
Bitcoin's net flows to the cryptocurrency exchanges
Source: Intotheblock
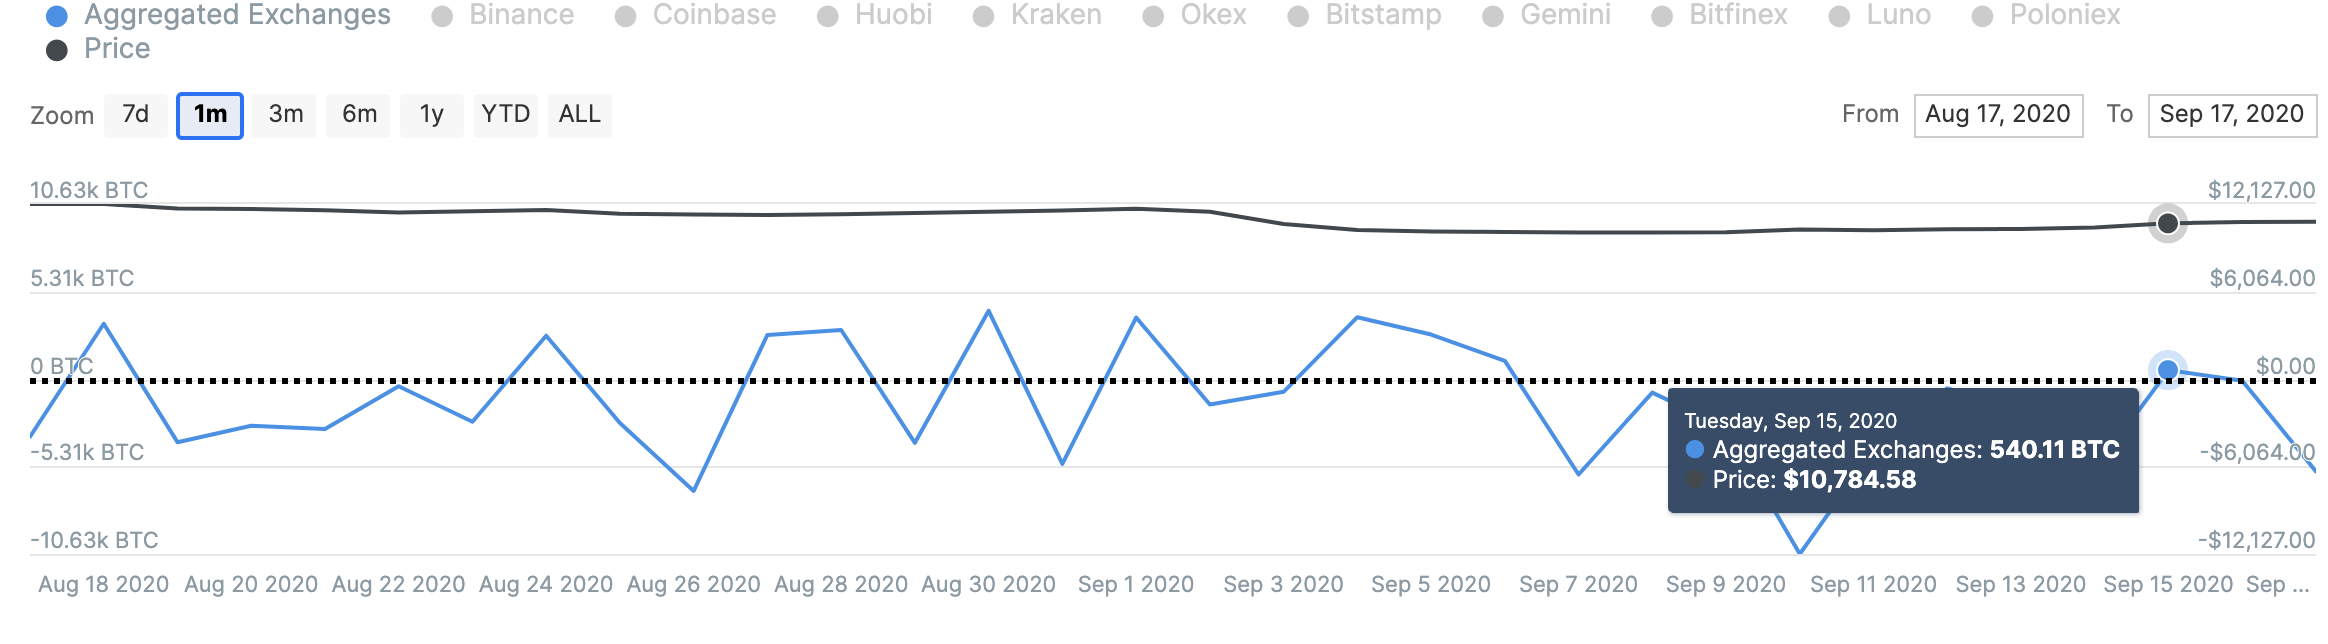
A deeper dive into the on-chain metrics reveals that Bitcoin bulls may be less inclined to sell as BTC's net flows to the cryptocurrency exchange accounts are in the negative territory. It means that the market is entering an accumulation phase as people take continue taking their coins from the hot wallets to the cold wallets. Bitcoin net inflows to the exchanges peaked on September 15 and started falling, moving in sync with the price recovery. If this trend persists, we may see an increased buying pressure as sellers are leaving the market.
Bitcoin's holders' distribution
Source: Santiment
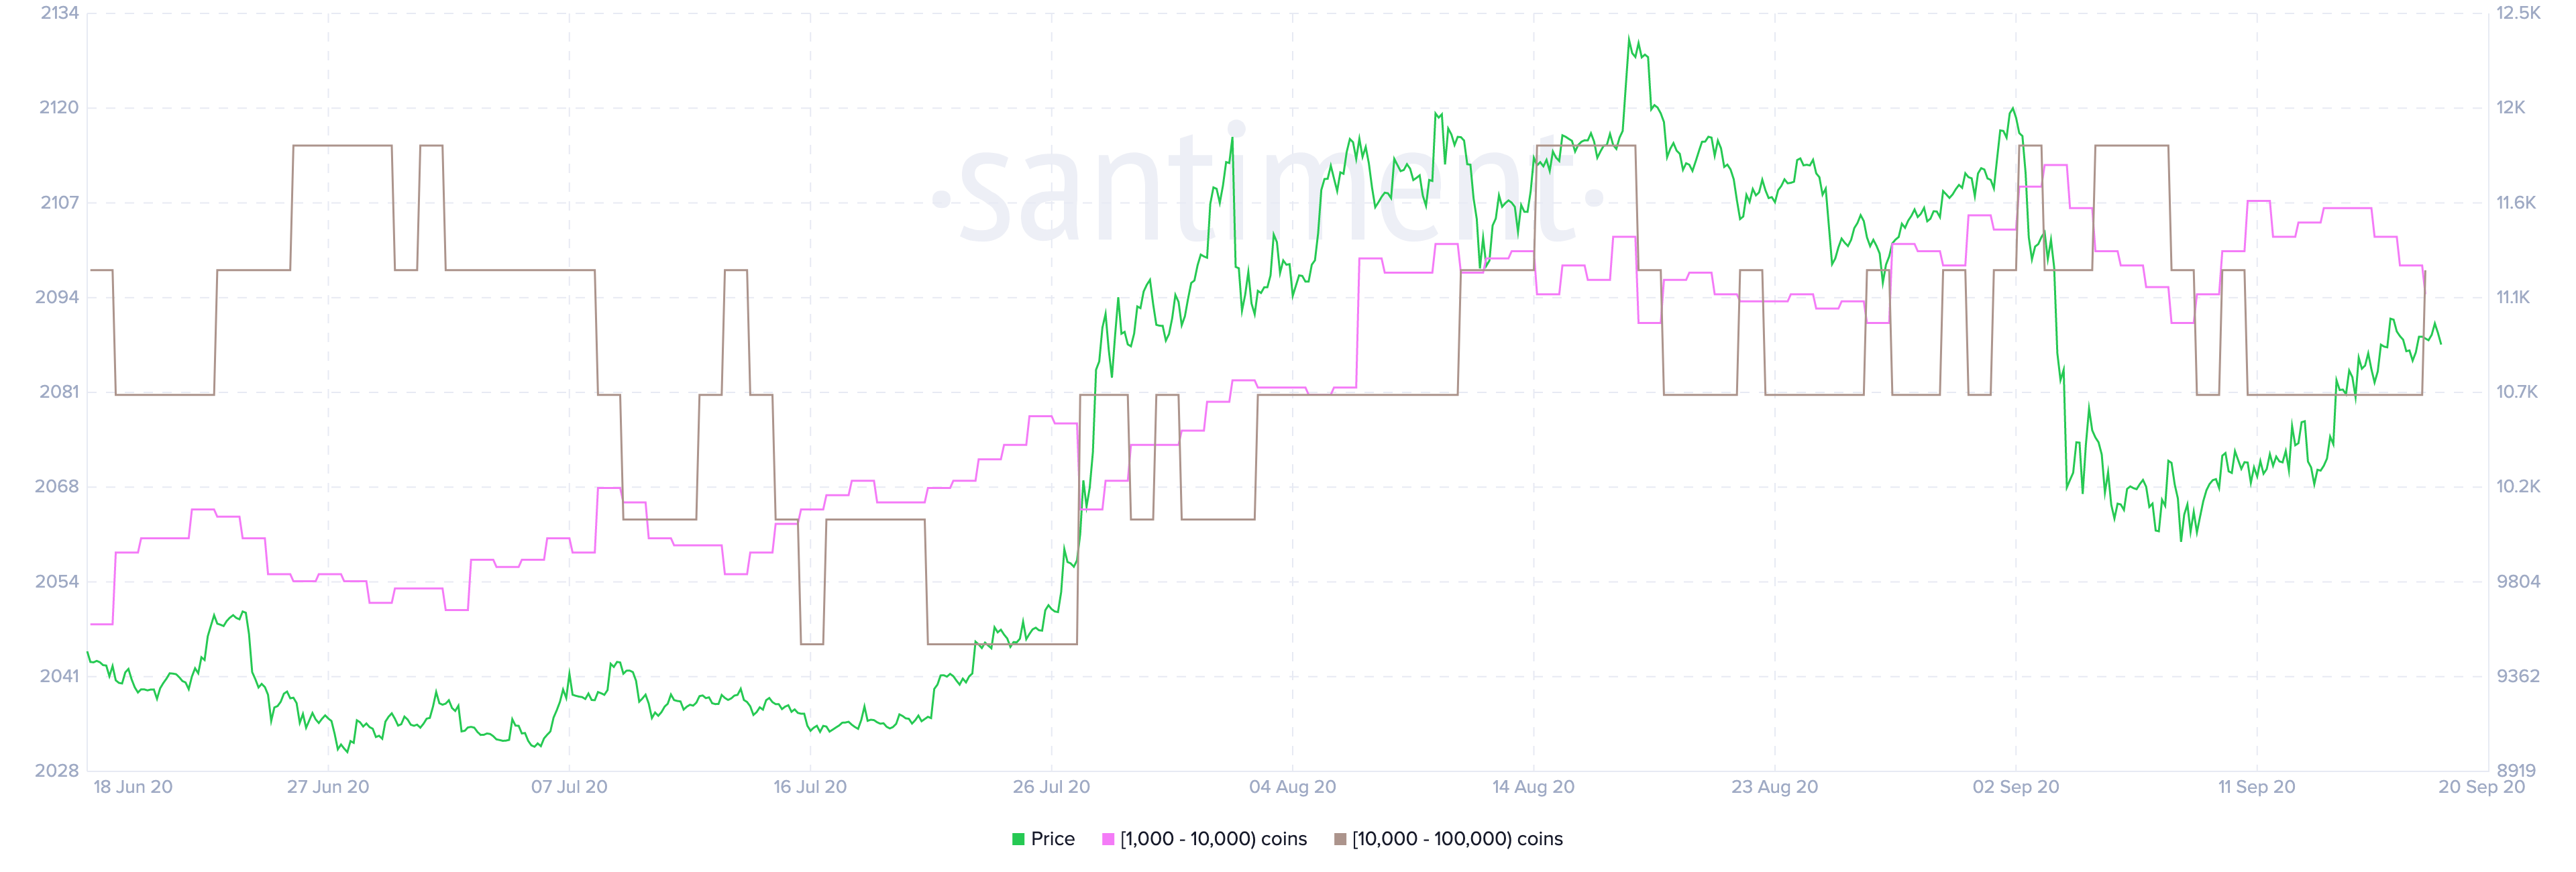
Another reason to be cautious with the outright bearish forecasts is Bitcoin's holders' distribution data. According to Santiment's statistics, one whale with at least 10,000 coins in their wallet has entered the network, while the number of wallets with over 1,000 has been trending higher in the last three months. The behavior of large Bitcoin investors tends to have a massive impact on price momentum. If the number of whales continues moving higher, the BTC price is likely to follow the trend.
BTC/USD weekly chart
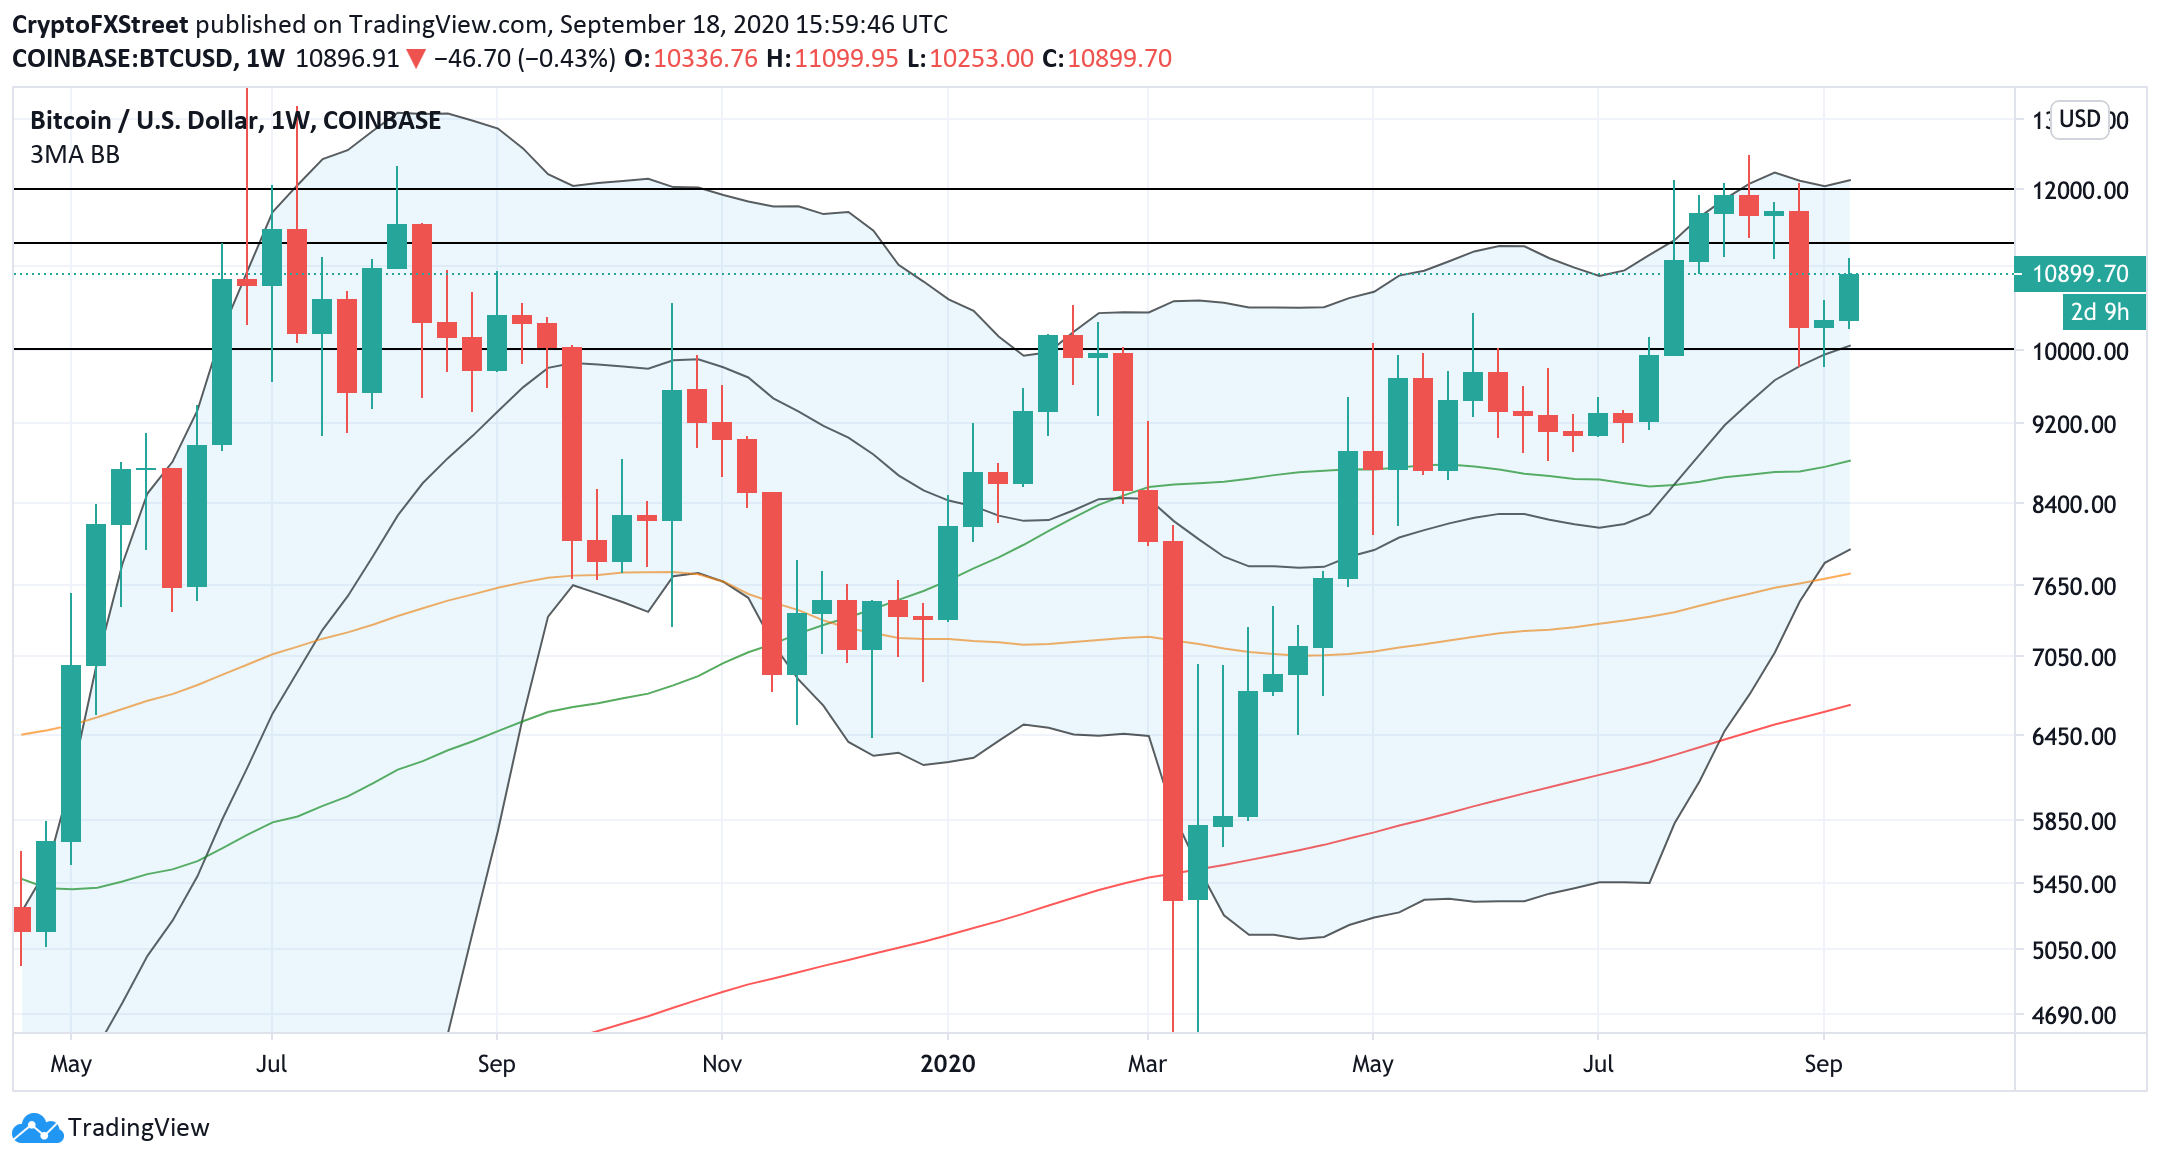
Let's zoom out to the weekly chart, where BTC/USD has created a big green candle after a Doji candle of the previous week. The middle line of the weekly Bollinger Band at $10,000 serves as local support, reinforced by the lower line of the consolidation channel that dominated the market since the beginning of September. The prices tested this Bollinger Band line twice, and each time they reversed to the upside, meaning that bears may be intimidated by this area.
However, once it is broken, $8,800 may come into focus. This barrier is created by the weekly SMA50 that limited the sell-off since the beginning of May.
To conclude: The current technical and on-chain setup implies that BTC may continue moving inside the broad range limited by $11,000 and $10,000. Several technical indicators send bearish signals, but significant support created by market orders may slow down the bears and trigger another recovery attempt. A sustainable move below $10,000 will worsen the immediate technical picture and bring more sellers to the market with the long-term target at $8,800.
On the other hand, $11,000 needs to be taken out for the recovery to gain traction. However, the bulls will have to make their way through a thick layer of barriers until $11,900-$12,000. Once they manage to break free, the upside momentum may start snowballing.
The decreasing cryptocurrency exchange deposits and the slowly growing number of whales imply that BTC chances are tilted to the upside from the long-term perspective.
Bitcoin Forecast Poll
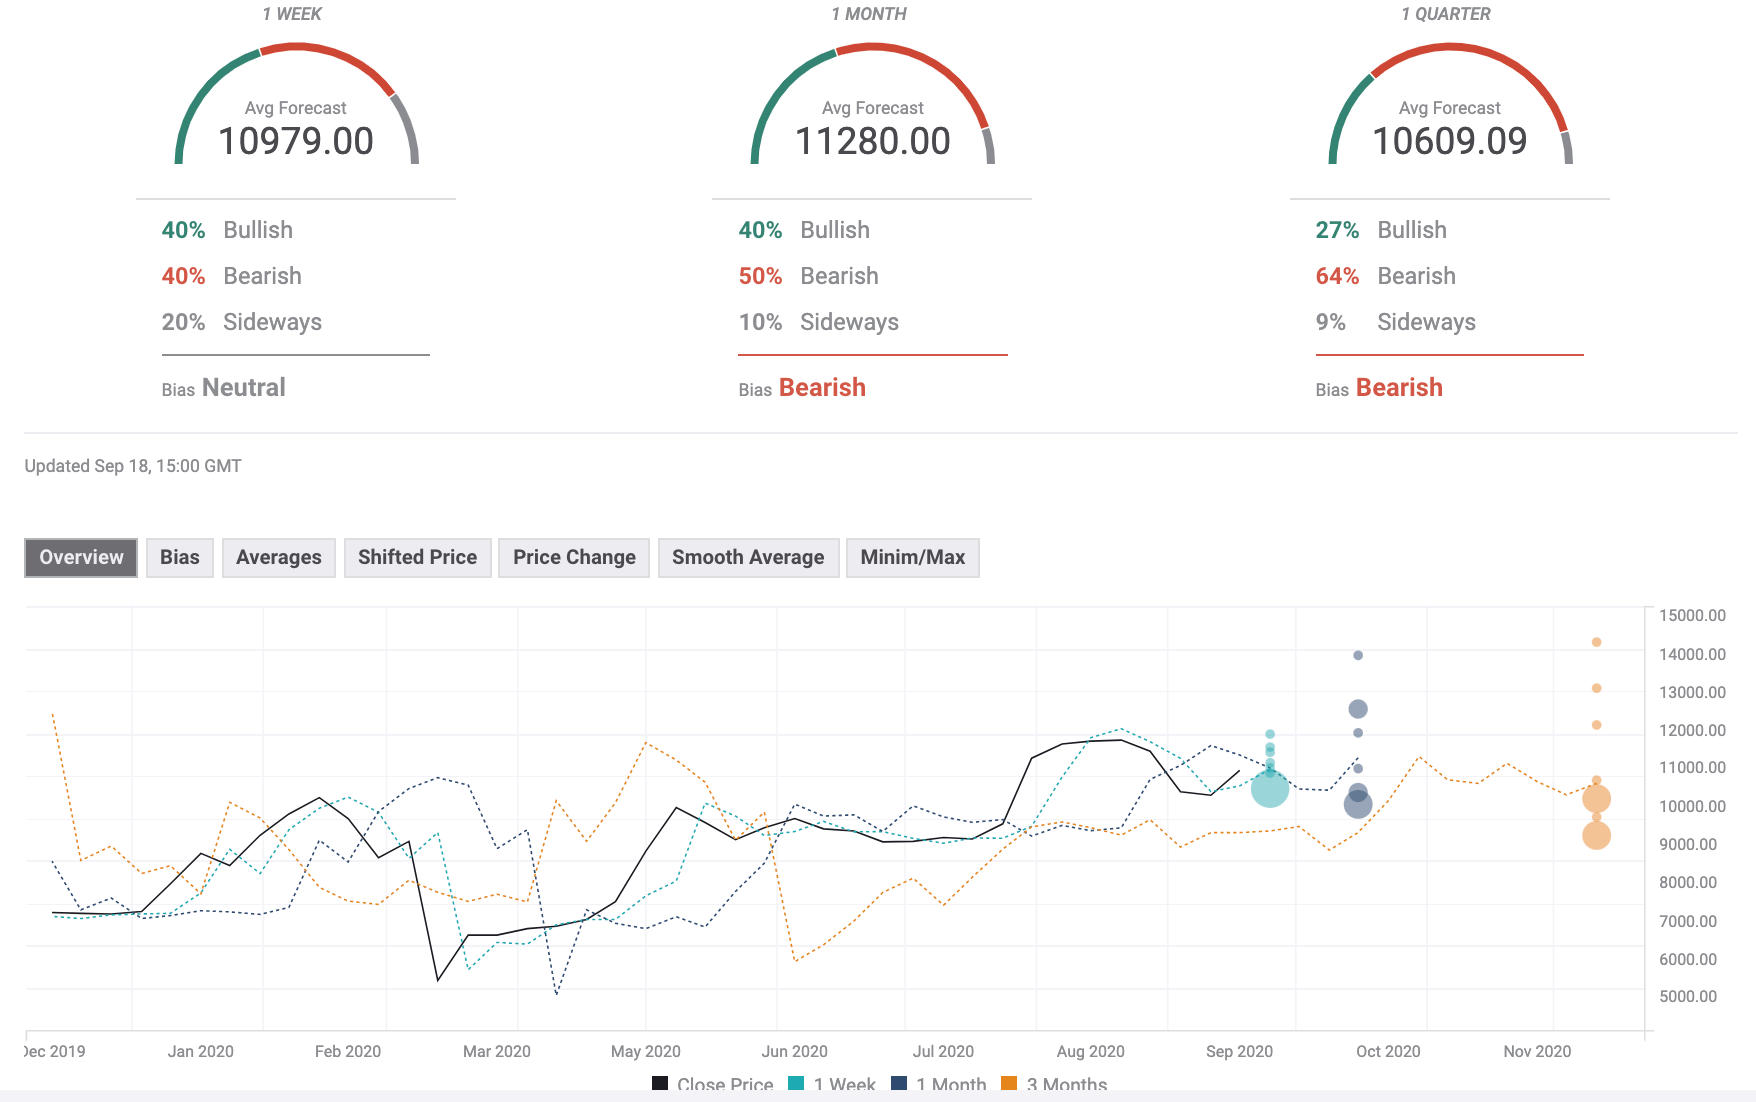
The BTC/USD Forecast Poll has improved marginally since the previous week as expectations on all but weekly time frames remained bearish. Now the experts believe that the risks are tilted to the downside both in the short run and in the long period; however, the price expectations on a monthly time frame moved above $11,000. It means that no one expects a sustainable Bitcoin price increase. According to the median price forecast, the first digital coin will stay range-bound around the current levels.
Author

Tanya Abrosimova
Independent Analyst



