Ethereum Price Forecast: Uniswap pushes ETH near $400 levels – Confluence Detector
- Ethereum has experienced a sudden dip in token velocity.
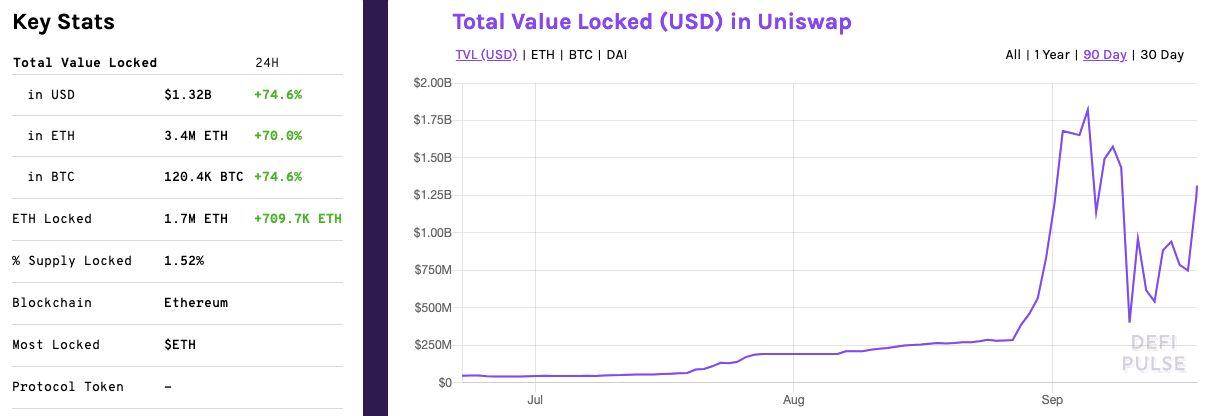
- The total value locked in Uniswap has spiked by 75% over the last 24 hours.

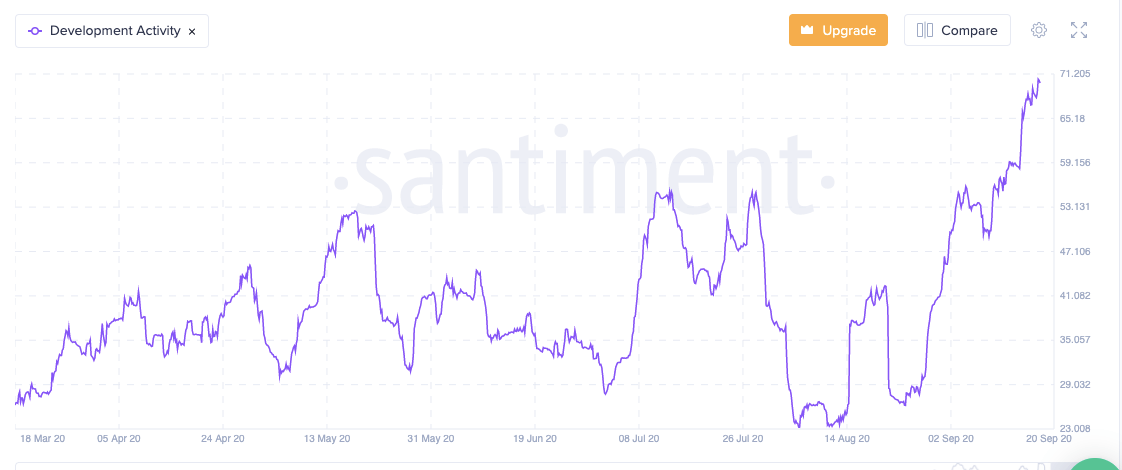
As per Santiment, Ethereum’s on-chain development shows a spike in recent development activity.
There is another interesting chart from Santiment that you should take a look into.
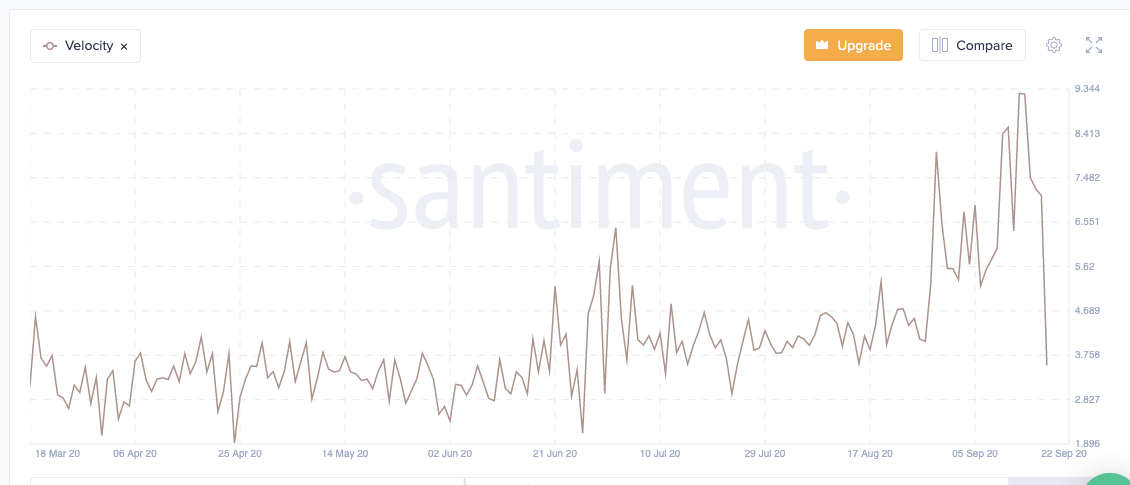
The graph above shows Ethereum’s token velocity. As you can see, there has been a significant dip in the overall velocity. So, why is this important? Let’s first understand what token velocity actually means.
What is token velocity?
If you were to define Token Velocity in strictly mathematical terms, then it would look like this:
Token Velocity = Total Transactional Volume / Average Network Value.
What this means is:
- Token velocity and average network value are inversely proportional to each other.
- Token velocity and transaction volume are directly related to each other.
So, the value of a network will increase only if its native tokens have low velocity, aka, investors should hold on to the token instead of just selling them.
This is important because it shows that a token that’s more than a simple medium of exchange will have more chances of success. So, projects must actively integrate methods within their tokens and protocol that organically reduces velocity. One of these tactics happens to be staking. After all, if you have tokens locked up in a protocol, you will not be spending them, right?
What dipped Ether’s velocity?
Now, we know that the spike in Ethereum development activity could be one of the following - more DeFi-related work or ETH 2.0 related stuff. However, such a sudden drop in velocity could only mean that more users have locked up more of their ETH in DeFi.
Uniswap driving the price
The total value locked (TLV) up in DeFi has gone back above $9 billion. The chief driver here is Uniswap, which has seen its TLV spike by 75% over the last 24 hours.
As previously reported, Uniswap recently launched its native UNI tokens, which has attracted a lot of interest from the community. This has been quite a remarkable resurgence for them after their liquidity got compromised by SushiSwap users.
ETH/USD daily chart
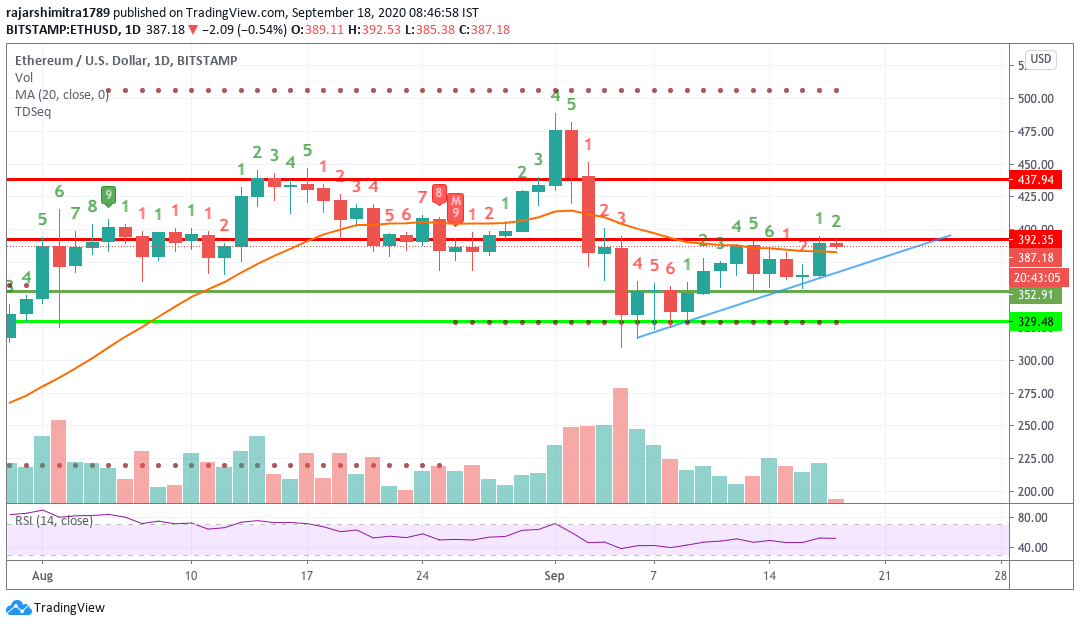
ETH/USD daily is currently consolidating in an ascending triangle formation and is negotiating with the $392.35 resistance line. However, the relative strength index is still hovering in the neutral zone, so both the bulls and bears have the full license to take control. The latest candlestick has the green-2 label in the TD indicator. This means that we are currently in an upward swing, so the price should break above the triangle and jump past the $400-level.
ETH/USD 4-hour chart
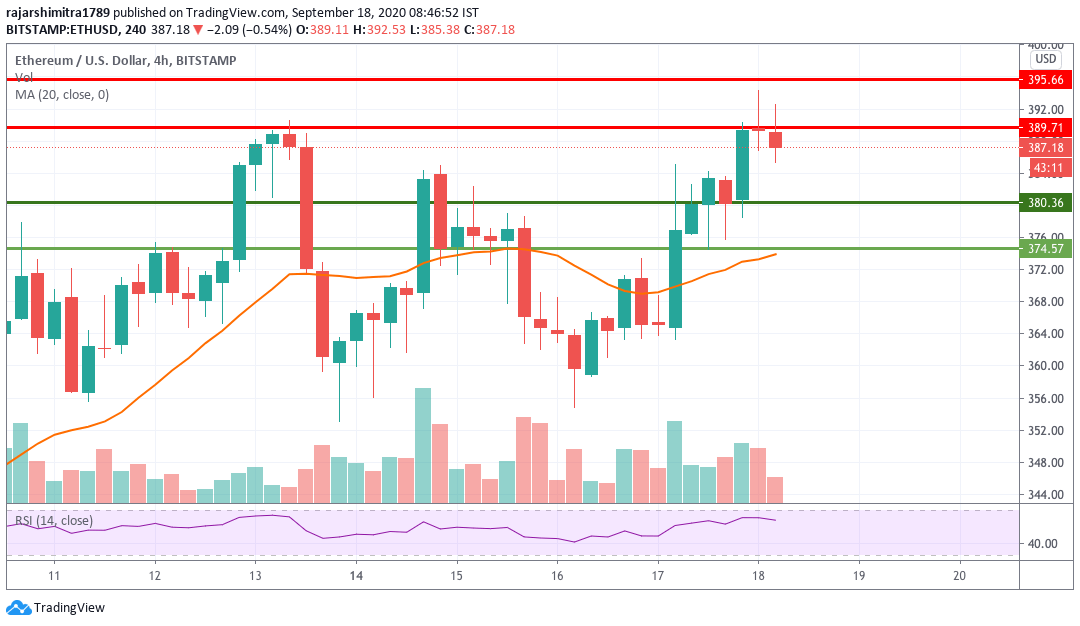
The 4-hour ETH chart had climbed from $359 to 390 before it encountered strong resistance. Following that, the candlesticks charted the bearish evening star pattern and dropped down. If the bears take control in the mid-term, the bulls must make sure that the $380 support level holds strong.
ETH daily confluence detector
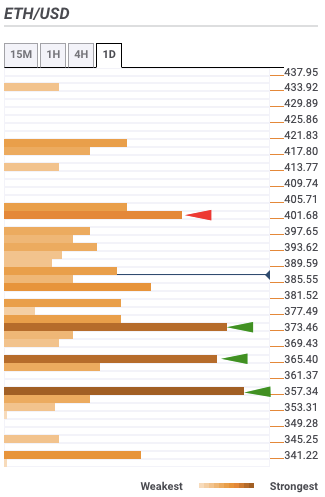
ETH daily confluence detector shows us that the price has plenty of upside potential. There is a moderate resistance level at $403. This level has the daily Pivot Point one resistance-one and one-month Fibonacci 38.2% retracement level. The buyers should be able to break past this level. After that, there is a lack of strong resistance levels to $450.
On the downside, there are three healthy support levels at $375, $367 and $360. The $375-level has the one-month Fibonacci 61.8% retracement level. The $367-level has the Previous year high and one-day Previous low. Finally, the $360 resistance level has the monthly Pivot Point one support-one.
Author

Rajarshi Mitra
Independent Analyst
Rajarshi entered the blockchain space in 2016. He is a blockchain researcher who has worked for Blockgeeks and has done research work for several ICOs. He gets regularly invited to give talks on the blockchain technology and cryptocurrencies.


