Bitcoin price sustains uptrend as Chinese investors stampede out of local market in favor of US-focused ETFs
- Bitcoin price is trading horizontally, trapped within the upper range of the Bollinger Indicator.
- BTC could make a 5% move north soon to clear the $43,750 blockade as volatility increases.
- A strong break and close below the centerline of the Bollinger at $41,880 would invalidate the bullish thesis.
- ETF specialist Eric Balchunas highlights how Chinese investors are flocking to the US ETF market.

Bitcoin (BTC) price continues to sustain its bullish outlook, holding above a key support level. Among other drivers, the spot BTC exchange-traded fund (ETF) theme continues to drive markets even as investor countdown to the halving event continues.
Also Read: Bitcoin price scenarios to consider with approaching BTC halving event
US Bitcoin ETF market entices Chinese investors
Reports by Eric Balchunas, a specialist at Bloomberg Intelligence focusing on exchange-traded funds (ETF), highlight that “Chinese investors are stampeding out of their local market in favor of the US-focused ETFs”. This is seen with spikes in total volume of ETFs traded in China.
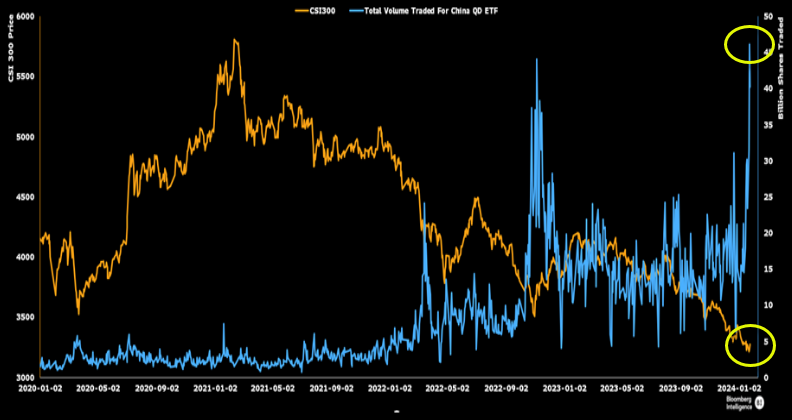
Total volume traded for China
According to Balchunas, quotas remain a challenge, as the Chinese are buying in at premiums of up to 43%, which has the government issuing warnings. Quotas are an official limit on the number or amount of purchases allowed.
Nevertheless, Balchunas observes that Chinese traders don’t care about the quotas because the US ETF market is hugely driven by the fear of missing out (FOMO).
China so beat up and US at record highs and then you add on the premium, it becomes selling low and buying high on steroids, feels like it could end in tears for the local China investors.
— Eric Balchunas (@EricBalchunas) February 6, 2024
It comes as the Chinese markets continue to suffer on the back of a real estate crisis. The situation is so extreme that the country had to tighten its stock market rules in a bid to halt a deepening sell-off in the world's second-largest economy.
Clear two horse race among 9 new spot bitcoin ETFs…
— Nate Geraci (@NateGeraci) February 5, 2024
BlackRock & Fidelity.
That said, *strong* middle class developing in this category.
ARK & Bitwise on path to hit $1bil in not too distant future.
Invesco now over $300mil.
Both Valkyrie & VanEck $100+mil.
via @apollosats pic.twitter.com/ST4j6UFeIF
Bitcoin price outlook comes into focus as crypto analyst calls for less volatility
Despite BTC ETFs in the US proving popular, Bitcoin price is trading horizontally, absent any directional bias. It is trapped between the centerline and the upper band of the Bollinger indicator at $41,919 and $44,278, respectively.
Although the odds favor the upside, given that the Relative Strength Index (RSI) is above the 50 midline and the Moving Average Convergence Divergence (MACD) and Awesome Oscillator (AO) indicators are in positive territory, the market remains indecisive.
According to @CarpeNoctom, a trader and analyst who examined BTC on the weekly time frame, more volatility contraction is needed before volatility expansion as the weekly Bollinger bands are somewhat spaced out.
The Bollinger indicator is interpreted such that when bands contract, it means volatility is reducing. The reverse is true in that as volatility increases, the bands expand. A significant contraction of the bands with the asset’s price between the upper band and the centerline means the odds favor the upside.
However, if the price of the asset lies between the centerline and the lower band of the Bollinger indicator, the market favors the downside. The volatility expansion follows this dynamic, expanding toward the direction in which the market is leaning.
With the Bollinger indicator traditionally used in the daily time frame, based on the evaluation by @CarpeNoctom, Bitcoin price could record a volatility expansion favoring the upside. The reasoning is that it lies atop the centerline of the Bollinger indicator at $41,919, with the upper band and the centerline coming together, thus showing volatility contraction.
Increased buying pressure could see BTC shatter the upper band at $44,278, potentially extending the gains to the $46,000 psychological level. In a highly bullish case, Bitcoin price could tag $48,000 or extend a neck higher to the $50,000 level. Such a move would denote a 15% climb above current levels.
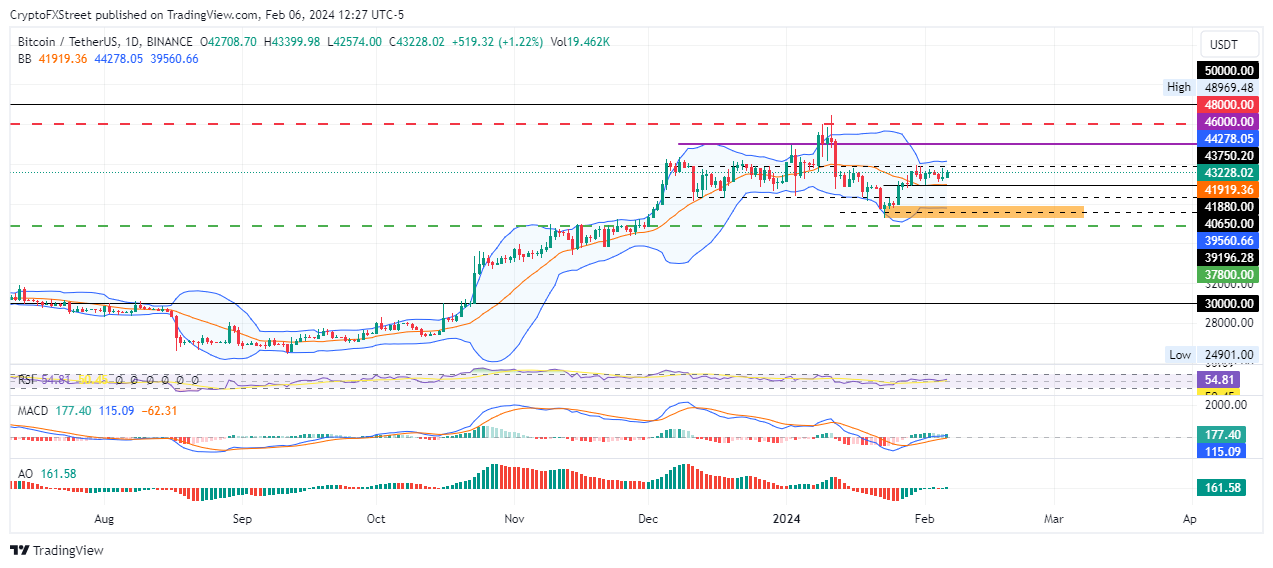
BTC/USDT 1-day chart
On the flip side, if the bulls show weakness, the bears could seize the market, sending the Bitcoin price below the centerline. An extended fall could see BTC slip to the lower band of the Bollinger indicator at $39,560, marking a foray into the demand zone between $38,496 and $39,895. A break and close below the midline of this order block at $39,196 would confirm the continuation of the fall.
The next logical targets for Bitcoin price in such a directional bias would be $37,800 or, in a dire case, $30,000. A daily candlestick close below this psychological level would invalidate the prevailing bullish outlook.
Bitcoin, altcoins, stablecoins FAQs
What is Bitcoin?
Bitcoin is the largest cryptocurrency by market capitalization, a virtual currency designed to serve as money. This form of payment cannot be controlled by any one person, group, or entity, which eliminates the need for third-party participation during financial transactions.
What are altcoins?
Altcoins are any cryptocurrency apart from Bitcoin, but some also regard Ethereum as a non-altcoin because it is from these two cryptocurrencies that forking happens. If this is true, then Litecoin is the first altcoin, forked from the Bitcoin protocol and, therefore, an “improved” version of it.
What are stablecoins?
Stablecoins are cryptocurrencies designed to have a stable price, with their value backed by a reserve of the asset it represents. To achieve this, the value of any one stablecoin is pegged to a commodity or financial instrument, such as the US Dollar (USD), with its supply regulated by an algorithm or demand. The main goal of stablecoins is to provide an on/off-ramp for investors willing to trade and invest in cryptocurrencies. Stablecoins also allow investors to store value since cryptocurrencies, in general, are subject to volatility.
What is Bitcoin Dominance?
Bitcoin dominance is the ratio of Bitcoin's market capitalization to the total market capitalization of all cryptocurrencies combined. It provides a clear picture of Bitcoin’s interest among investors. A high BTC dominance typically happens before and during a bull run, in which investors resort to investing in relatively stable and high market capitalization cryptocurrency like Bitcoin. A drop in BTC dominance usually means that investors are moving their capital and/or profits to altcoins in a quest for higher returns, which usually triggers an explosion of altcoin rallies.
Author

Lockridge Okoth
FXStreet
Lockridge is a believer in the transformative power of crypto and the blockchain industry.


