Here’s what needs to happen for The Graph price to revisit $0.422
- The Graph price trades inside the $0.192 to $0.494 range.
- Investors need to wait for GRT to overcome $0.343 before being bullish on GRT.
- If successful, GRT could rally 50% and revisit the $0.422 hurdle.
- A decisive daily candlestick close below $0.192 will invalidate the bullish thesis.

The Graph (GRT) price consolidation below a key hurdle shows that it is ready for a volatile move. With GRT retesting the upper limit of its rangebound movement, chances of an upside breakout are high.
Read more: Arkham price primed for a recovery rally ahead of OpenAI’s announcement
The Graph price ready to breakout
The Graph price crashed 61% between March 10 and April 13 and was soon followed by a tight consoldiation below the $0.318 resistance level. As GRT knocks of the aforementioned hurdle’s doors, it suggests that the altcoin is primed for a move higher.
The Relative Strength Index (RSI) and Awesome Oscillator (AO) are both comfortably hovering above their respective mean levels of 50 and 0, suggesting that the bulls are in control. Although the outlook for GRT is bullish, investors need to wait for a recovery above $0.318 as well as $0.343, which is the midpoint of the 61% crash.
If The Graph price successfully establishes itself above $0.343, it woulld signal that the altcoins is ready to move higher. In such a case, GRT will encounter the $0.366 hurdle which needs to be tackled before the Ai-based token revisits $0.422.
In total, this move would constitute a 50% gain for GRT holders.
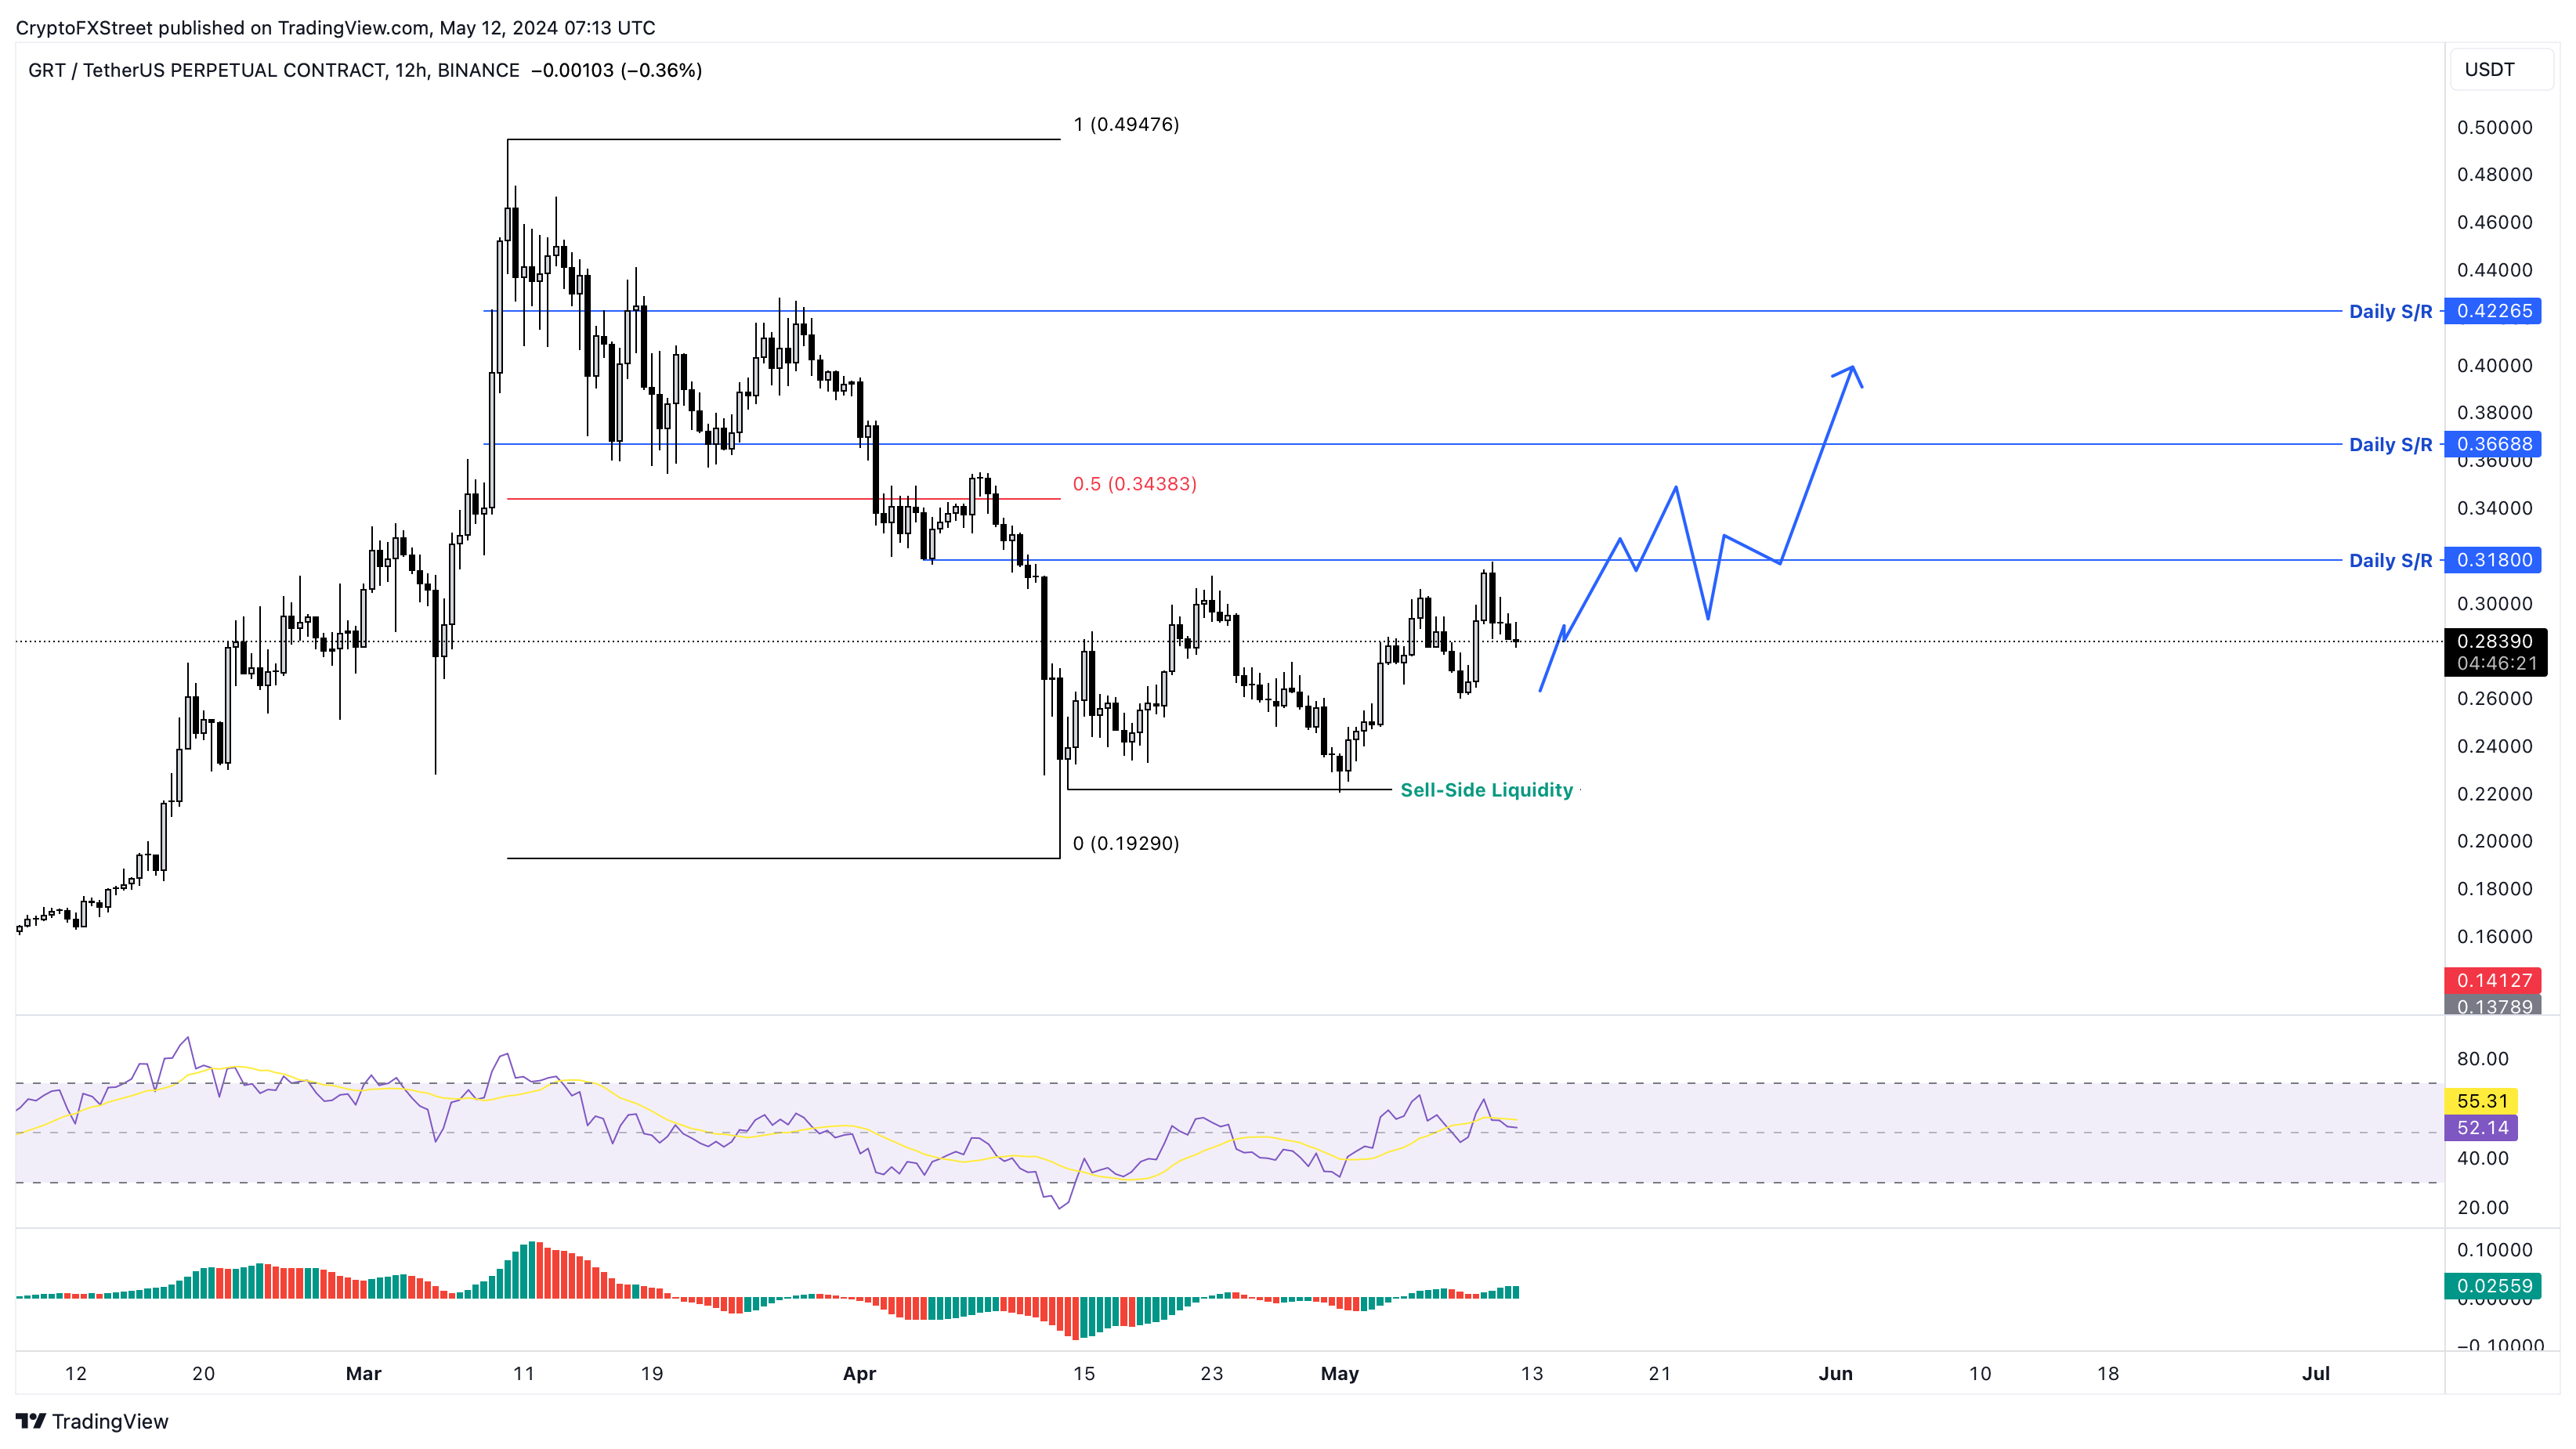
GRT/USDT 12-hour chart
While the outlook for The Graph price looks really profitable, there is a catch. The swing lows formed around the $0.221 is very crucial and could make or break the early and impatient bulls. In some cases, if the crypto market outlook does not turn bullish, then GRT could slide lower to collect the sell side liquidity below $0.221.
If this move is followed by a quick recovery above the said level, then it is a buy signal for patient holders. However, a decisive daily candlestick close below $0.221 without a recovery rally will create a lower low and invalidate the bullish thesis.
This development could further knock The Graph price down 13% to tag the range low of $0.192.
Also read: Ripple price breaches 700-day trend line, signaling a gloomy picture for XRP holders
Author

Akash Girimath
FXStreet
Akash Girimath is a Mechanical Engineer interested in the chaos of the financial markets. Trying to make sense of this convoluted yet fascinating space, he switched his engineering job to become a crypto reporter and analyst.


