• Bitcoin price continues to trade horizontally with technical indicators showing limited upside potential.
  • BTC could drop 5% after multi-week consolidation below the $43,750 blockade.
  • The bearish thesis will be invalidated if the price breaks and closes above $46,000.

Appearing on Monday, Federal Reserve chair Jerome Powell expressed worrisome comments about the US government's unsustainable path.

Also Read: Top 3 Price Prediction Bitcoin, Ethereum, Ripple: BTC to record rash move soon as Bollinger Bands contract

Powell underlines a bullish thesis for Bitcoin

Fed chair Jerome Powell said the US is on an "unsustainable path" as debt will outpace economic growth. In his opinion, investors will soon question the government's ability to pay its debt, which will push them towards dumping the US dollar in favor of a hedge. In such a turn of events, Bitcoin would pass as the best candidate for this hedge.

Bitcoin price outlook with a possible 5% drop in the works

Bitcoin price remains range-bound, consolidating between the centerline and the upper band of the Bollinger indicator at $41,882 and $44,182. The two levels appear to be coming together, a move that often precipitates an impulsive or rash move soon.

The Relative Strength Index (RSI) is bearish and could soon break below the yellow band (signal line). Tilting the odds further in favor of the bears, the Moving Average Convergence Divergence (MACD) also appears subdued below its histogram bars and could soon fall in negative territory. The Awesome Oscillators (AO) are also flattened out, a sign of dissipating bullish presence.

With this outlook, Bitcoin price could fall 5% to find support offered by the confluence between the 100-day Simple Moving Average (SMA) and the horizontal line at $40,651. Below this level, BTC could dip into the demand zone between $38,496 and $39,582.

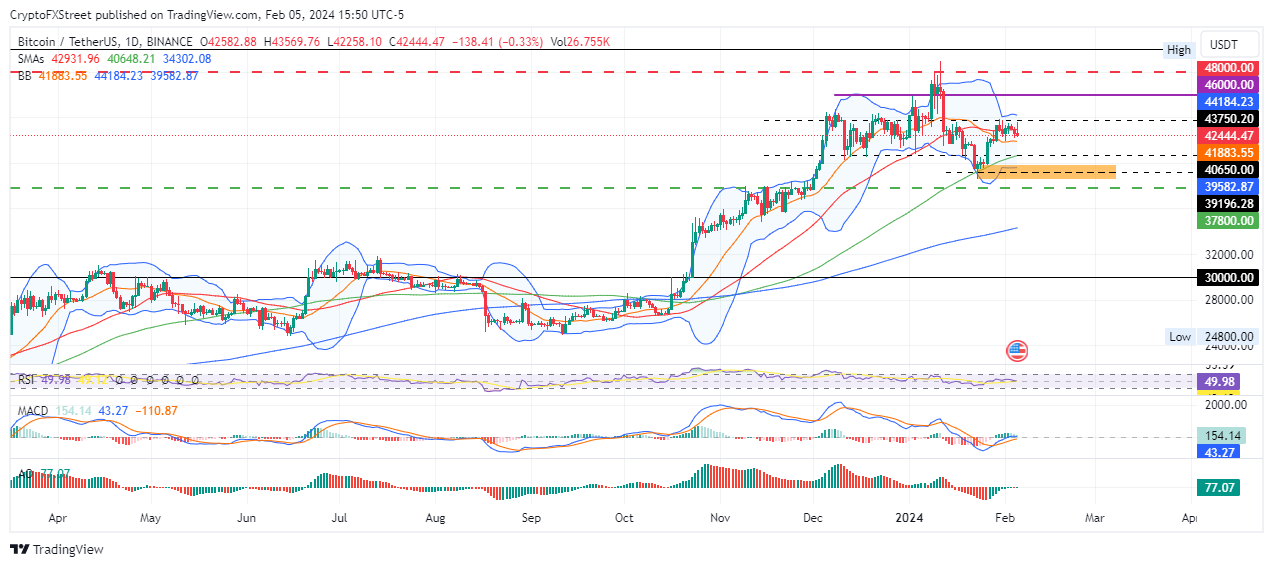
BTC/USDT 1-day chart

On the other hand, increased buying pressure could see Bitcoin price overcome the resistance due to the upper band of the Bollinger indicator at $44,184. This could see BTC climb to $48,000, or in a highly bullish case, tag $50,000. Such a move would denote a 20% climb above current levels.


Information on these pages contains forward-looking statements that involve risks and uncertainties. Markets and instruments profiled on this page are for informational purposes only and should not in any way come across as a recommendation to buy or sell in these assets. You should do your own thorough research before making any investment decisions. FXStreet does not in any way guarantee that this information is free from mistakes, errors, or material misstatements. It also does not guarantee that this information is of a timely nature. Investing in Open Markets involves a great deal of risk, including the loss of all or a portion of your investment, as well as emotional distress. All risks, losses and costs associated with investing, including total loss of principal, are your responsibility. The views and opinions expressed in this article are those of the authors and do not necessarily reflect the official policy or position of FXStreet nor its advertisers. The author will not be held responsible for information that is found at the end of links posted on this page.

If not otherwise explicitly mentioned in the body of the article, at the time of writing, the author has no position in any stock mentioned in this article and no business relationship with any company mentioned. The author has not received compensation for writing this article, other than from FXStreet.

FXStreet and the author do not provide personalized recommendations. The author makes no representations as to the accuracy, completeness, or suitability of this information. FXStreet and the author will not be liable for any errors, omissions or any losses, injuries or damages arising from this information and its display or use. Errors and omissions excepted.

The author and FXStreet are not registered investment advisors and nothing in this article is intended to be investment advice.

Join Telegram

Recommended content


Recommended Content

Editors’ Picks

Could Worldcoin price shoot up 45% ahead of OpenAI’s live stream on Monday?

Could Worldcoin price shoot up 45% ahead of OpenAI’s live stream on Monday?

Worldcoin has formed a double bottom around a key support level, suggesting a potential accumulation. If the OpenAI’s Monday live stream has a positive impact on Artificial Intelligence field, it could positively impact WLD and other AI-based tokens. 

More Worldcoin News

Here’s what needs to happen for The Graph price to revisit $0.422

Here’s what needs to happen for The Graph price to revisit $0.422

The Graph price trades inside the $0.192 to $0.494 range. Investors need to wait for GRT to overcome $0.343 before being bullish on GRT. If successful, GRT could rally 50% and revisit the $0.422 hurdle. A decisive daily candlestick close below $0.192 will invalidate the bullish thesis.

More The Graph News

SingularityNET price could bounce 30% if AGIX can hold this level

SingularityNET price could bounce 30% if AGIX can hold this level

SingularityNET price has been consolidating around the bottom of the $0.903 to $1.475 range for nearly a month. With some AI-tokens showing signs of revival, AGIX needs to be enalyzed for potential breakout opportunities like Arkham (ARKM).

More SingularityNET News

Arkham price primed for a recovery rally ahead of OpenAI’s announcement

Arkham price primed for a recovery rally ahead of OpenAI’s announcement

Arkham price eyes a potential reversal as it clears key hurdles. ARKM likely to rally 27% if it can overcome $2.74 resistance level. A breakdown of $2.28 wil invalidate the bullish thesis for the AI-based token.

More Arkham News

Bitcoin: Why BTC is close to a bottom

Bitcoin: Why BTC is close to a bottom

Bitcoin (BTC) price efforts of a recovery this week have been countered by selling pressure during the onset of the American session. However, the downside potential appears to have been capped. Markets have noted significant trading differences between sessions, and while the Asian market showed strength, whatever ground they were able to cover was oftentimes wiped out by traders in the US.

Read full analysis

BTC

ETH

XRP