Band Protocol Price Prediction: BAND must hold above $6 to make way for a 50% breakout
- Band Protocol bulls prepare to regain control over the price as technicals start to improve.
- Whales have started to stock on BAND; perhaps they anticipate a recovery coming into the picture.

Band Protocol appears to be gearing up for a massive 50% upswing as long as support at $6 holds its position. Simultaneously, the impact of the head-and-shoulders (H&S) pattern must come into play to support the expected breakout. In the meantime, BAND is doddering at $6.3 amid a bearish grip that seems to keep growing stronger.
Band Protocol is getting ready for a massive upswing
At the time of writing, Band Protocol is still in the bears’ hands. The Relative Strength Index seems to be validating the short term bearish outlook. However, with the formation of the H&S pattern, a significant reversal could be in the offing.
Moreover, the 4-hour chart shows that holding above the 200 Simple Moving Average would also be a powerful bullish signal. Marginally on the upside, the 50 SMA and the 100 SMA seem limiting movement, but once they are pushed into the rearview, Band Protocol’s uptrend will be reinforced.
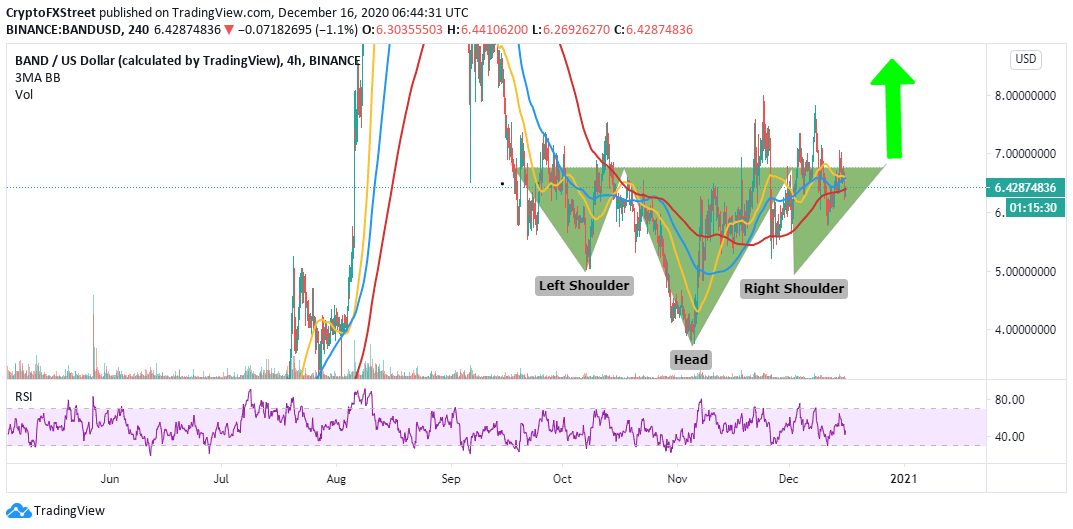
BAND/USD 4-hour chart
Santiment’s holder distribution chart highlights that the buying pressure behind Band Protocol surged radically over the past three days. The analytics firm recorded a significant spike in the number of addresses holding 100,000 and 10 million BAND from 16 to 18.
At first glance, the ongoing uptick in the number of whales buying BAND may seem insignificant. However, when considering the volume moved by these addresses, we can anticipate an intense tailwind developing behind Band Protocol and validating the bullish outlook.
%20[09.44.52,%2016%20Dec,%202020]-637436979220639789.png)
Band Protocol holder distribution chart
On the downside, the IOMAP model by IntoTheBlock suggests that recovery will be hampered between $6.6 and $6.8. Here, nearly 2,300 addresses had previously purchased roughly 2.3 million BAND. It is doubtful that the expected breakout will easily penetrate this supply area.
-637436979364864980.png)
Band Protocol IOMAP chart
On the downside, the support that has been accorded to BAND does not seem strong enough to support a massive upswing. Meanwhile, if the current bearish momentum continues, there is a likelihood BAND revising the anchor between $5.4 and $6.
Author

John Isige
FXStreet
John Isige is a seasoned cryptocurrency journalist and markets analyst committed to delivering high-quality, actionable insights tailored to traders, investors, and crypto enthusiasts. He enjoys deep dives into emerging Web3 tren


