Band Protocol Price Prediction: BAND bulls aim for a 50% upswing, but a correction may come first
- Band Protocol price is trading inside an inverse head-and-shoulders pattern on the daily chart.
- The digital asset is on the verge of a potential breakout but might need to pull back first.

BAND has been trading sideways after its massive 10,000% rally seen earlier in 2020. The digital asset is now going through consolidation and bounded inside an inverse head-and-shoulders pattern, which is on the verge of being broken out.
Band Protocol price faces a critical resistance level at $7.44
On the daily chart, the most essential resistance point is located at $7.44, which is the neckline of the inverse head-and-shoulders pattern. A breakout above this level can quickly drive Band Protocol price towards $11.
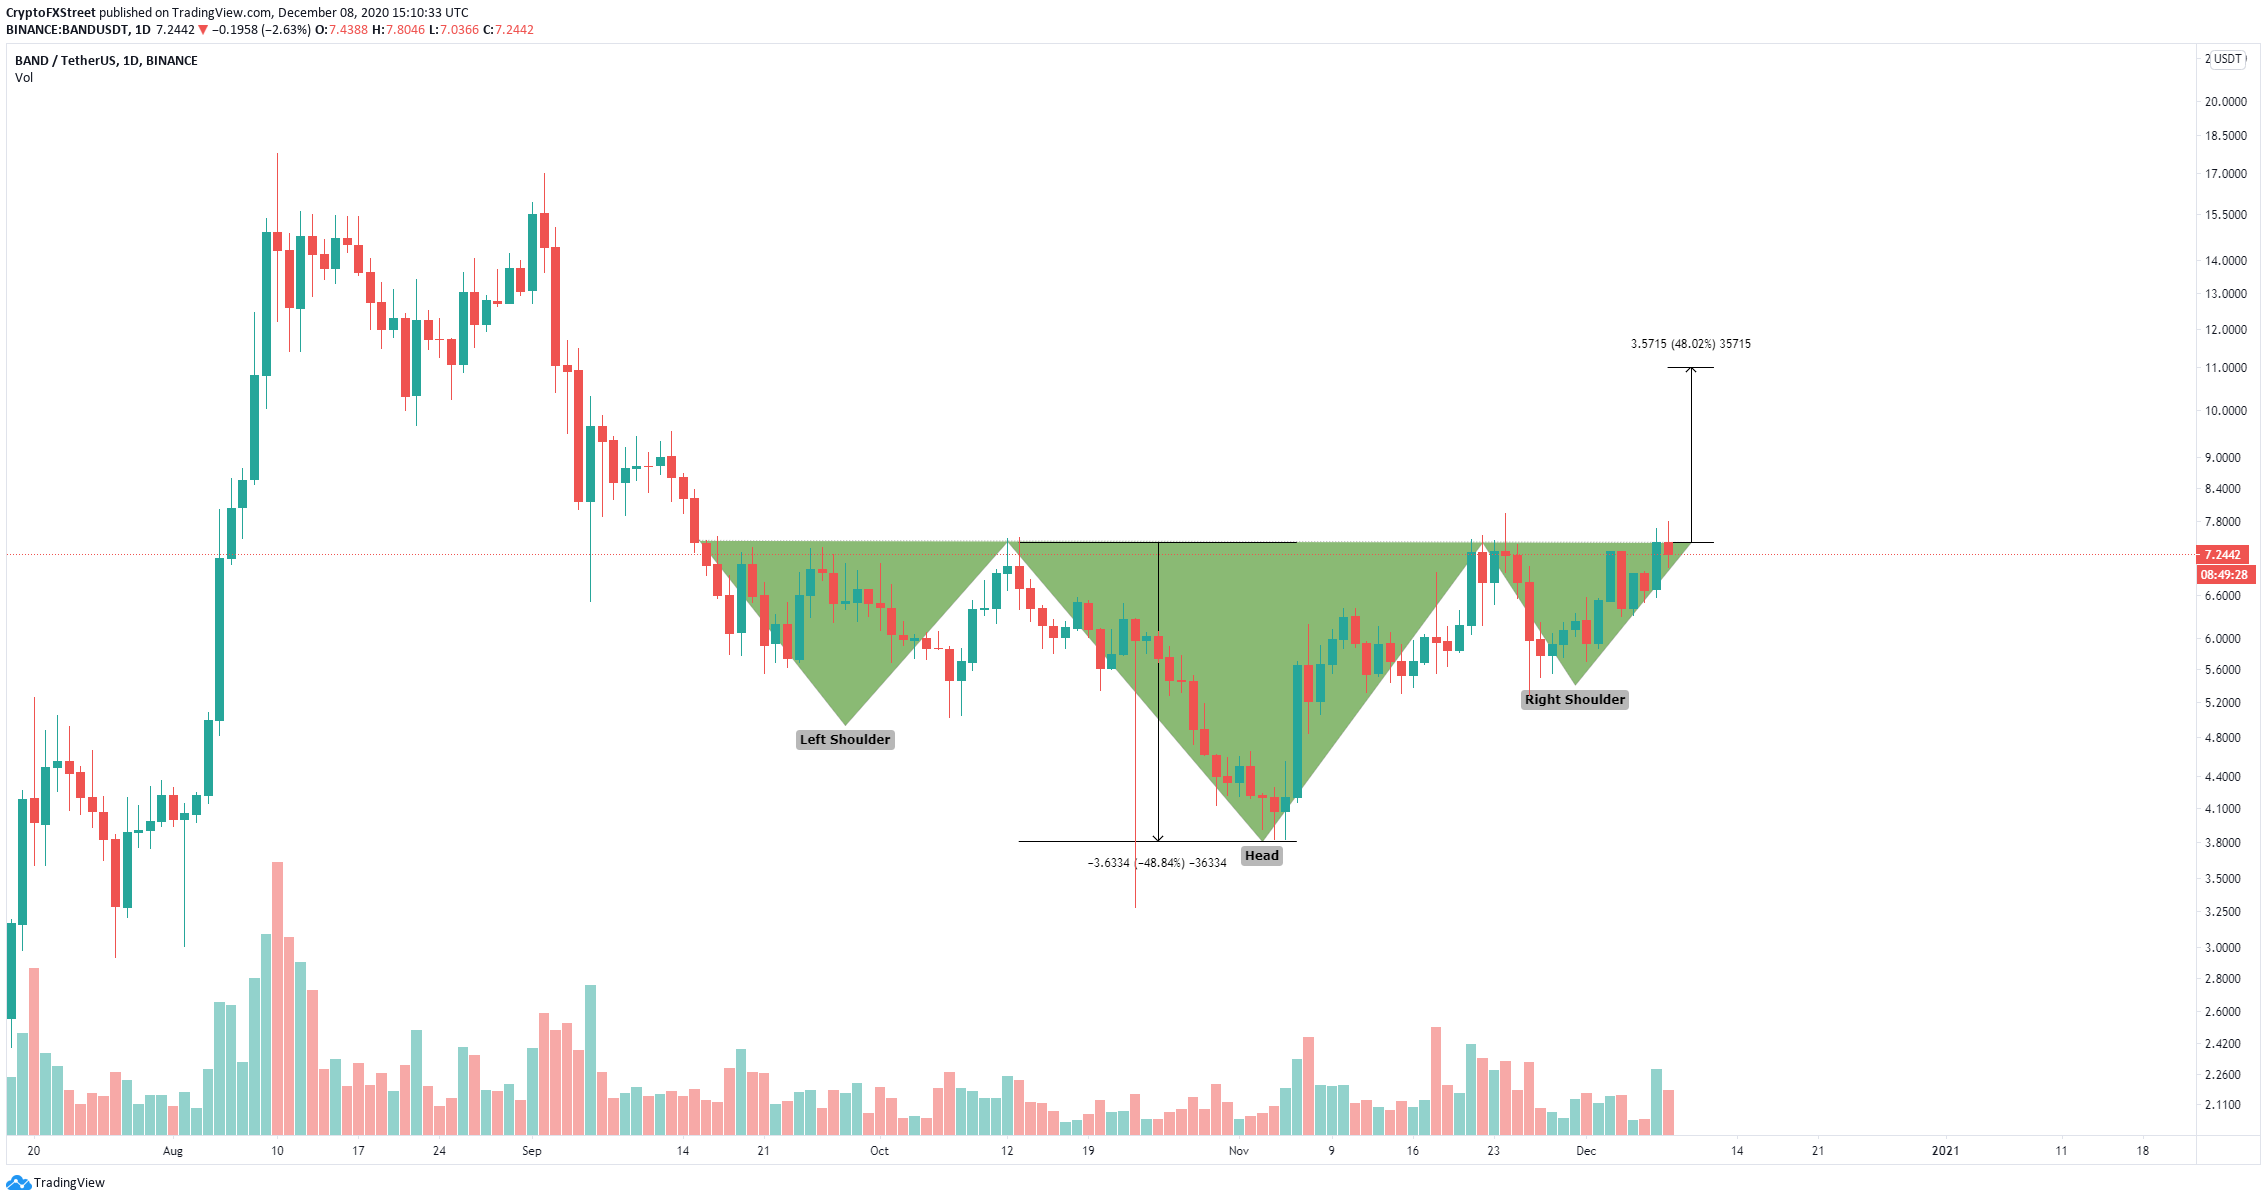
BAND/USD daily chart
Meanwhile, the In/Out of the Money Around Price (IOMAP) chart shows practically no resistance on the way up but a lot of support below $7.25. This metric clearly gives the bulls better odds of a breakout.
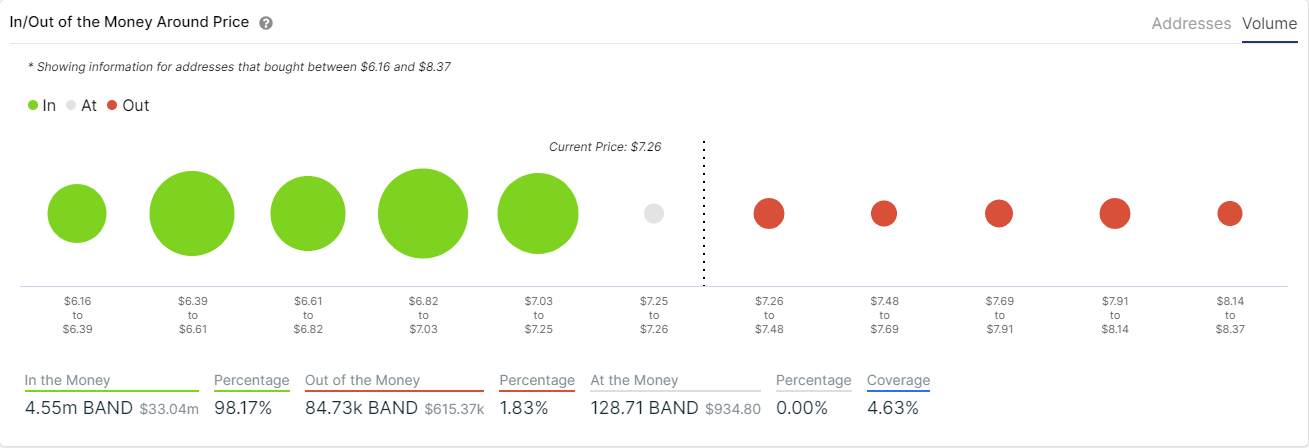
BAND IOMAP chart
However, it’s important to note that the TD Sequential indicator has just presented a sell signal on the daily chart. The last few bearish calls this indicator offered were all validated and had a significant bearish continuation.
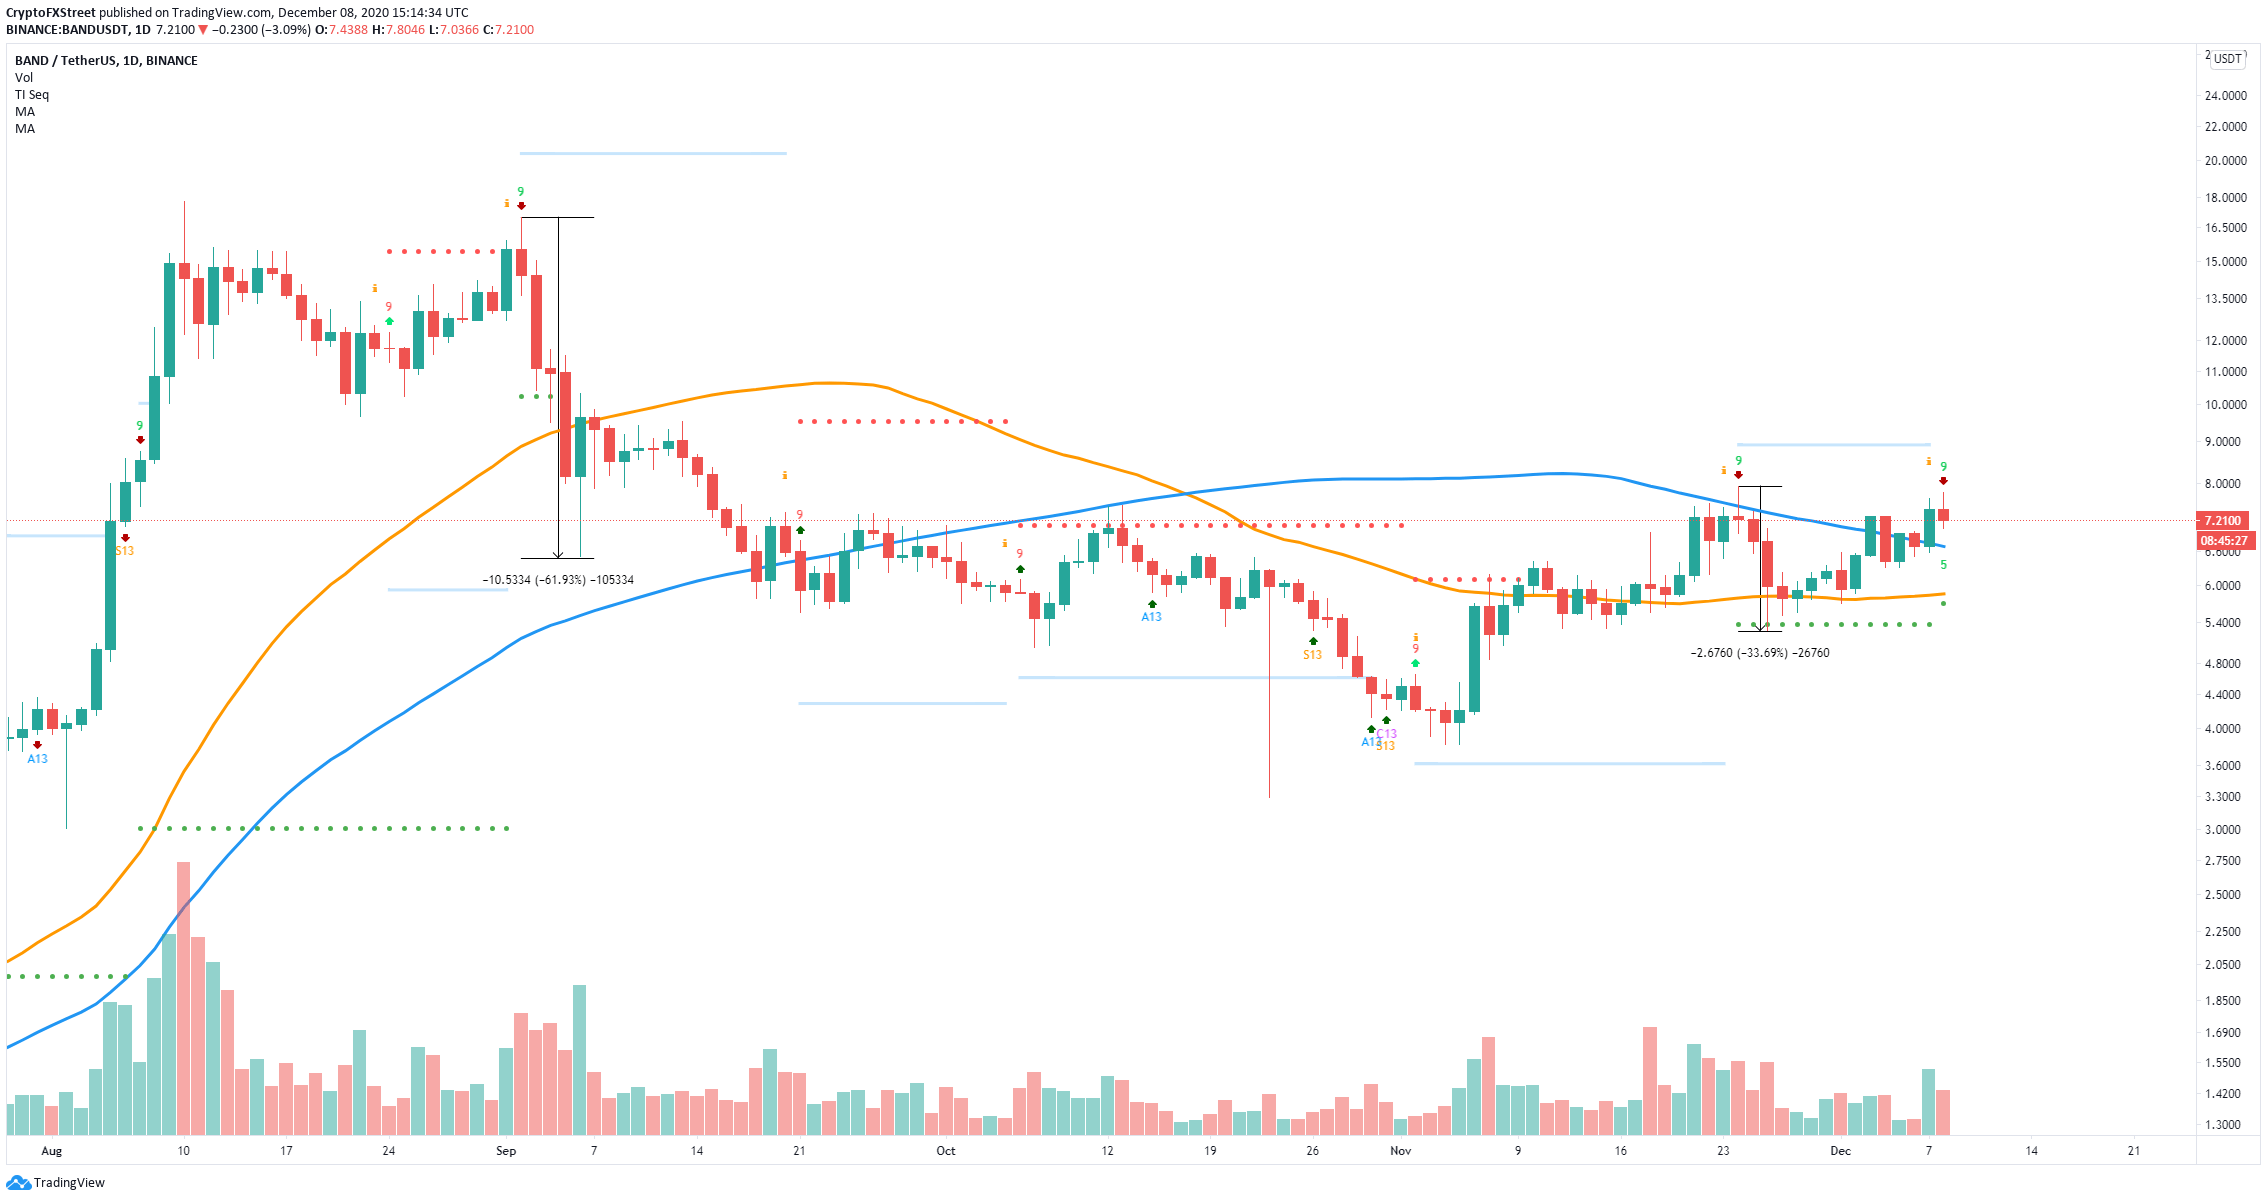
BAND/USD daily chart
Confirmation of the most recent sell signal could quickly drive Band Protocol price towards the 100-SMA support level at $6.7. If this point fails to hold, BAND could dive to the 50-SMA at $5.84.
Author

Lorenzo Stroe
Independent Analyst
Lorenzo is an experienced Technical Analyst and Content Writer who has been working in the cryptocurrency industry since 2012. He also has a passion for trading.


