|

Band Protocol price is on the verge of a massive 48% move, technicals suggest

  • Band Protocol price is bounded inside an ascending triangle pattern on the 12-hour chart.
  • The digital asset is close to a potential breakout or breakdown.

Band Protocol has been trading relatively sideways in the past week awaiting a clear breakout or breakdown from an ascending triangle pattern on the 12-hour chart. The digital asset should see a clear way within the next week.

Band Protocol price in a do-or-die scenario

BAND has established an ascending triangle pattern on the 12-hour chart and it is trading right in the middle of it. The upper trendline resistance level at $7.4 has proven to be a tough bone to chew for the bulls in the past.

band price

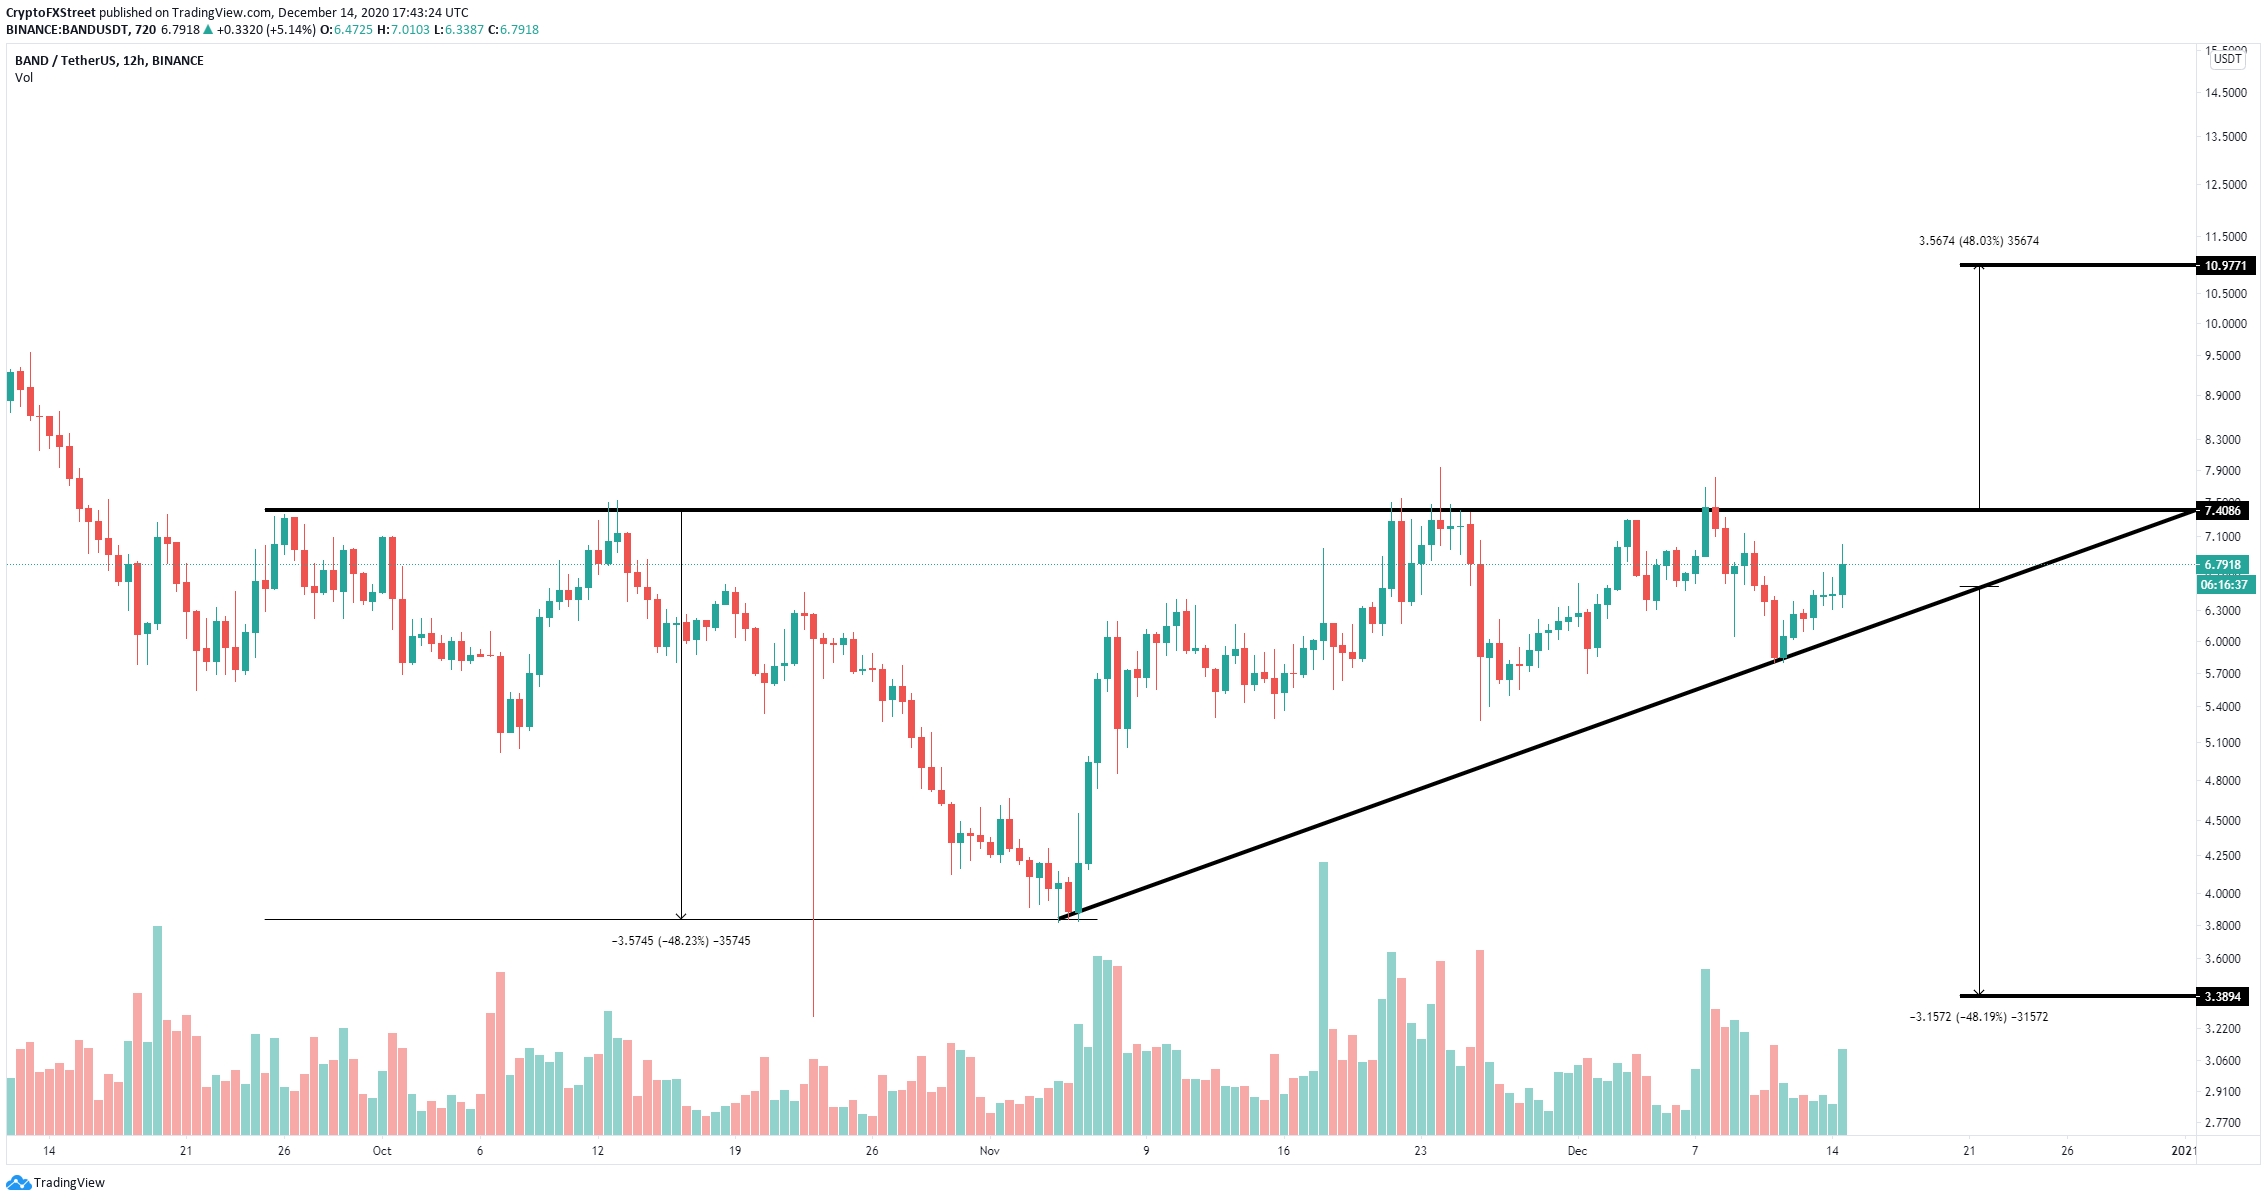
BAND/USD 12-hour chart

Currently, Band Protocol price is above the 50-SMA and the 100-SMA, which gives the bulls better odds for a breakout. Cracking the critical resistance level at $7.4 would push BAND towards $11.

On the other hand, a breakdown below the 50-SMA at $6.53 would be a bearish sign with the potential to push BAND towards the lower trendline of the ascending triangle. A breakdown below this point can drive Band Protocol price towards $3.4.

Author

Lorenzo Stroe

Lorenzo Stroe

Independent Analyst

Lorenzo is an experienced Technical Analyst and Content Writer who has been working in the cryptocurrency industry since 2012. He also has a passion for trading.

More from Lorenzo Stroe
Share:

Editor's Picks

Breaking: Bitcoin slips below $75,000 as selling pressure accelerates
Bitcoin (BTC) price falls below the $75,000 mark on Monday, having corrected nearly 11% in the previous week and reaching level not seen in nearly 10 months. Market momentum has clearly turned bearish, with technical indicators pointing to further downside toward the next key support at $70,000.
Shiba Inu Price Forecast: SHIB extends losses as whale selling intensifies bearish momentum

Shiba Inu (SHIB) price slips below $0.0000077 on Thursday after correcting the previous day. Bearish sentiment is further strengthened as holders offload SHIB, increasing selling pressure and reducing Open Interest in the derivatives market.

Top Crypto Losers: Worldcoin, Chiliz, Hyperliquid lead losses as market bleeds $1.75 billion

Worldcoin , Chiliz , and Hyperliquid posted heavy losses over the last 24 hours as Bitcoin dropped below $82,000 on Friday, triggering a $1.75 billion wipeout and mirroring the bearish tremors in the US stock market.

Fidelity unveils FIDD stablecoin, set to launch in coming weeks

Fidelity Investments announced that it will launch its first stablecoin, the Fidelity Digital Dollar (FIDD), making it one of the first large traditional firms in the US to do so.

Bitcoin Price Annual Forecast: BTC holds long-term bullish structure heading into 2026

Bitcoin (BTC) is wrapping up 2025 as one of its most eventful years, defined by unprecedented institutional participation, major regulatory developments, and extreme price volatility.

Bitcoin: BTC correction deepens as Fed stance, US-Iran risks, mining disruptions weigh

Bitcoin (BTC) price extends correction, trading below $82,000 after sliding more than 5% so far this week. The bearish price action in BTC was fueled by fading institutional demand, as evidenced by spot Exchange-Traded Funds (ETFs), which recorded $978 million in inflows through Thursday.