|

Band Protocol price moves closer to rebound territory as it sits on top of stable support

  • Band Protocol price is currently just above a critical support level at $5.55. 
  • Several indicators suggest that the digital asset could be on the verge of a significant upwards move.

Band Protocol price formed a robust support level at $5.55, which was tested several times since November 8. Successfully defending it again could drive Band Protocol price to higher highs on the 4-hour chart.

BAND awaits potential buy signal

On the 4-hour chart, the TD Sequential indicator has presented a red ‘8’, which is usually followed by a buy signal. Band Protocol price is currently $5.61, just above the critical support level at $5.55.

band price

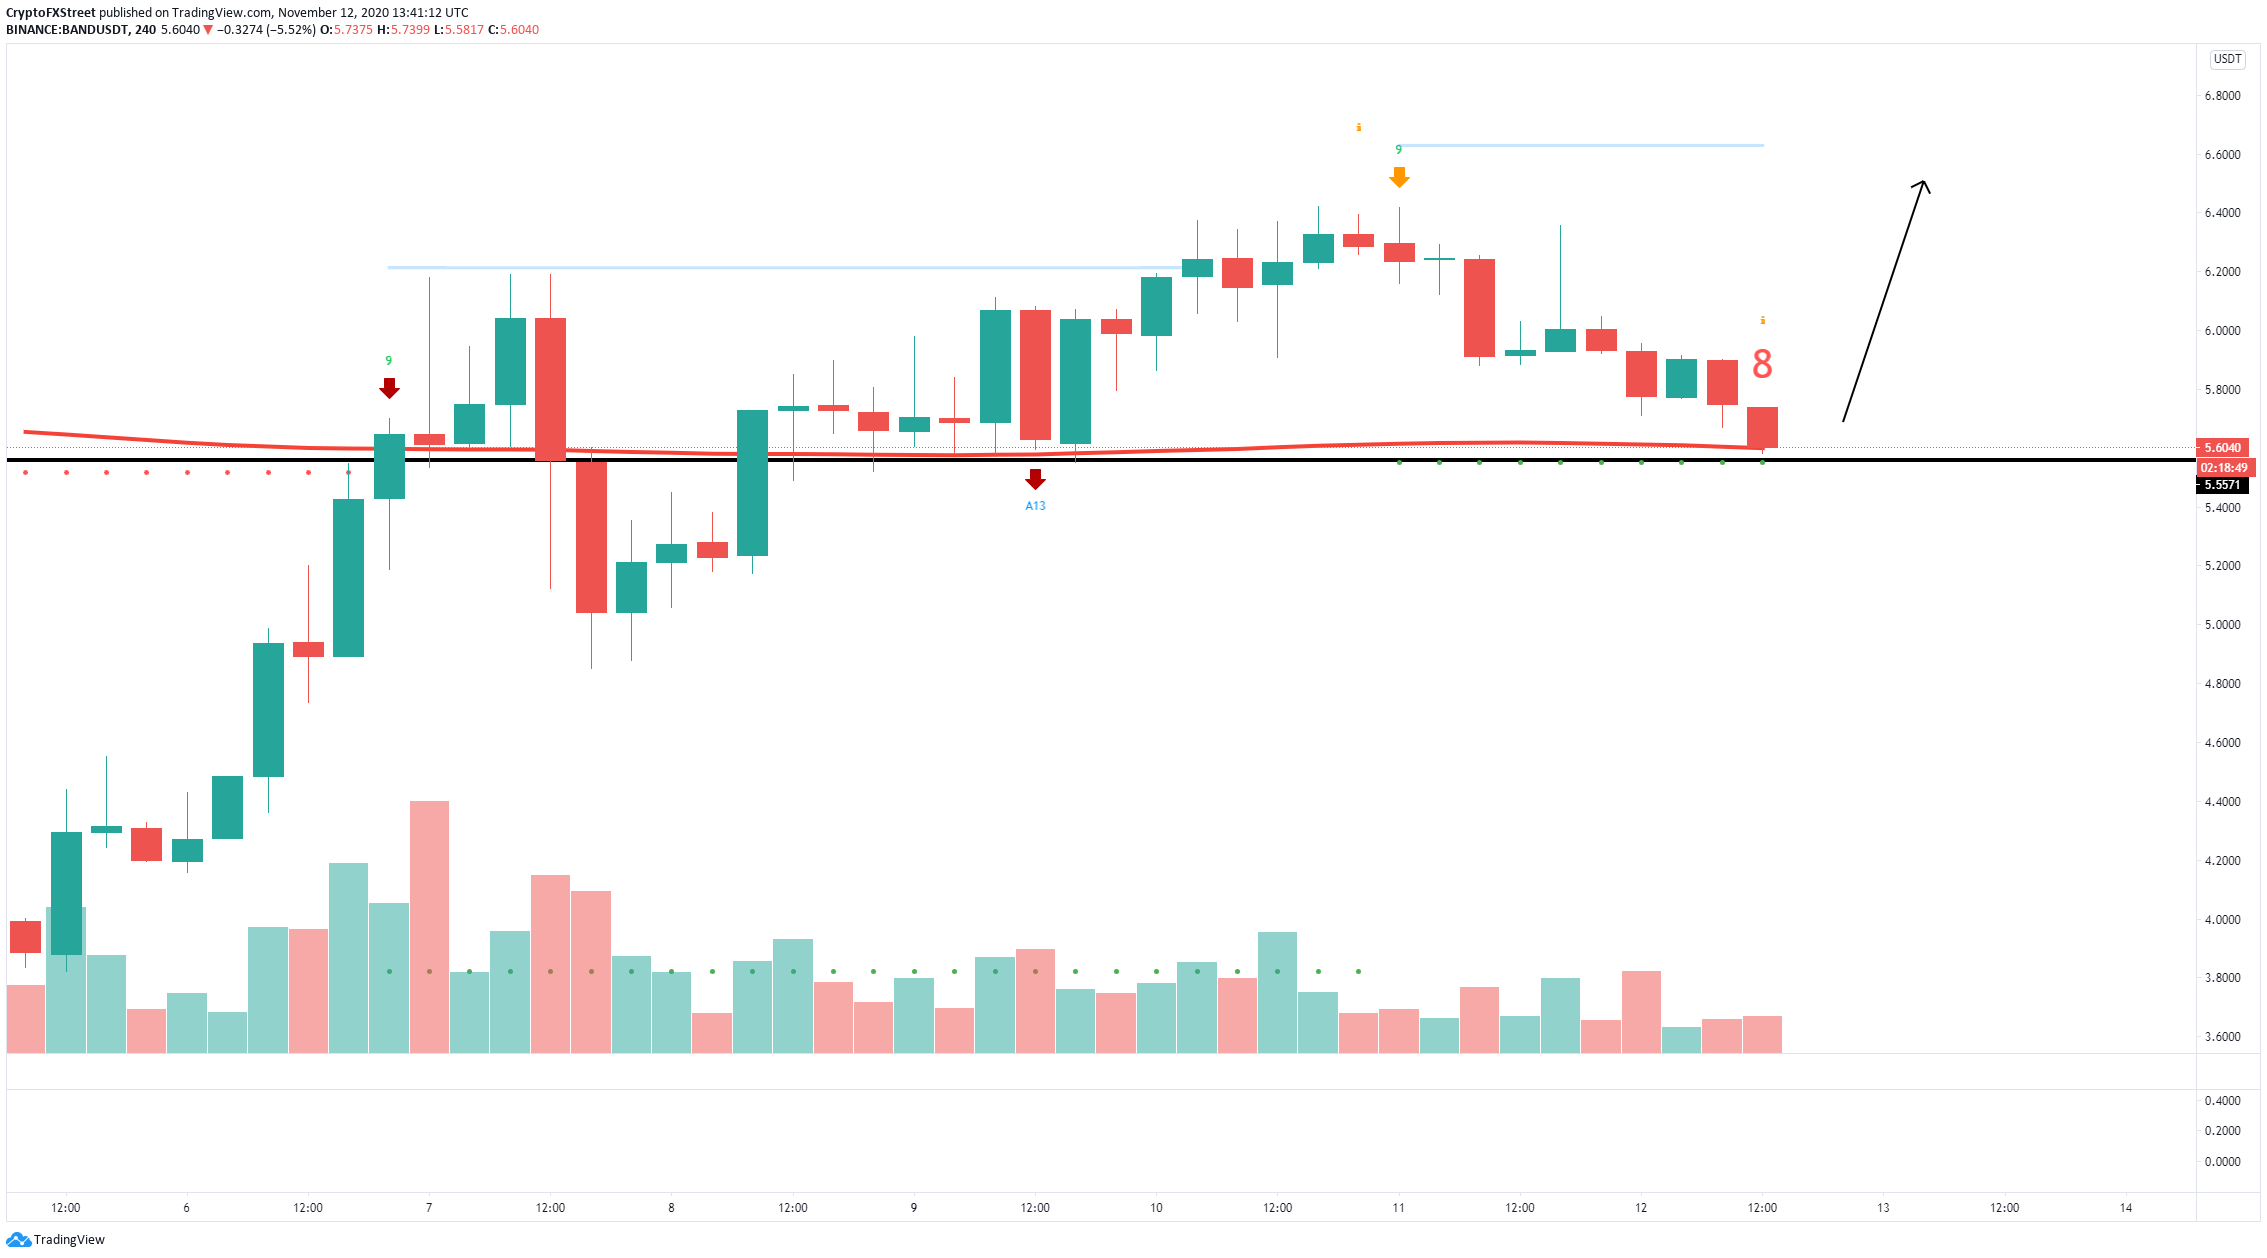
BAND/USD 4-hour chart

Bulls have extra support as the 200-SMA is also located at $5.61, adding more strength to the support level at $5.55. The In/Out of the Money Around Price (IOMAP) chart confirms this theory as it also shows a significant support area between $5.44 and $5.61.
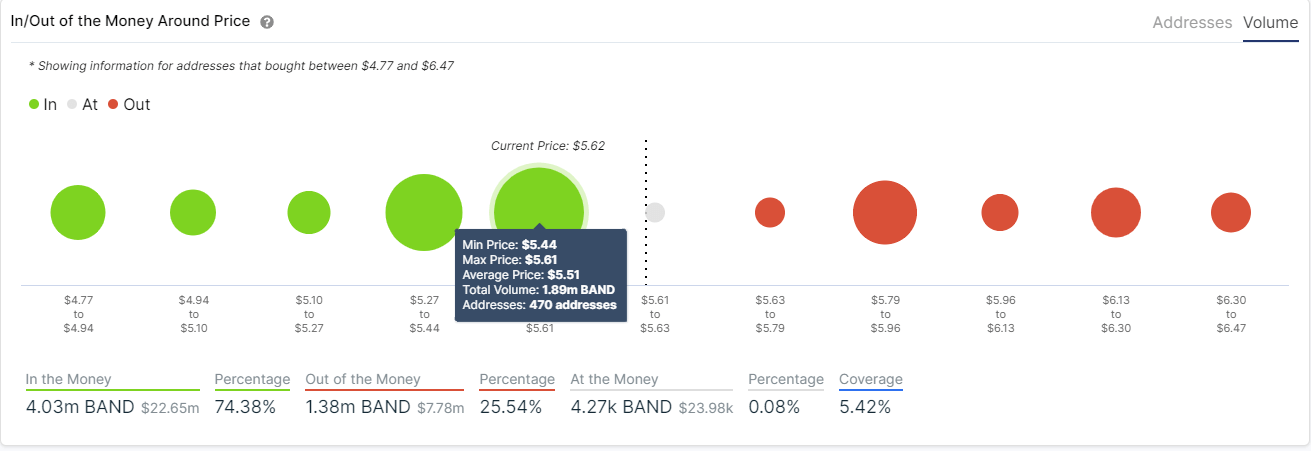
band price

BAND IOMAP chart

Around 470 addresses purchased 1.89 million BAND inside the robust support range mentioned above. On the other hand, there seems to be very little resistance until $6.50, which would be the initial price target if the buy signal is confirmed.  

However, because the support level at $5.55 is so strong, a breakdown from this point would be an extremely bearish signal, most likely driving Band Protocol price to the low of $4.85 established on November 7. 

Author

Lorenzo Stroe

Lorenzo Stroe

Independent Analyst

Lorenzo is an experienced Technical Analyst and Content Writer who has been working in the cryptocurrency industry since 2012. He also has a passion for trading.

More from Lorenzo Stroe
Share:

Editor's Picks

Bitcoin slips below $75,000 as selling pressure accelerates

Bitcoin (BTC) price falls below the $75,000 mark on Monday, having corrected nearly 11% in the previous week and reaching level not seen in nearly 10 months. Market momentum has clearly turned bearish, with technical indicators pointing to further downside toward the next key support at $70,000.

Top 3 Price Prediction: Bitcoin, Ethereum, and Ripple weakness persists after massive correction

Bitcoin, Ethereum and Ripple trade in red on Monday after dipping by over 11%, 19% and 13%, respectively, in the previous week. The top three cryptocurrencies have shed 10%, 17%, and 10.5% in the first month of 2026, highlighting persistent downside pressure.

Top Crypto Losers: Monero, Ethereum, and Kaspa face intense sell-off

Altcoins, including Monero, Ethereum, and Kaspa, are leading the broader cryptocurrency market decline with a steep correction on Sunday. Monero and Ethereum are close to critical support levels near $400 and $2,300, respectively.

Solana Price Forecast: SOL slips below $100, risks deeper correction

Solana (SOL) price extends its correction, trading below $100 on Monday after losing more than 15% in the previous week. The bearish price action is further backed by derivatives data, which shows rising short bets and negative funding rates.

Bitcoin Price Annual Forecast: BTC holds long-term bullish structure heading into 2026

Bitcoin (BTC) is wrapping up 2025 as one of its most eventful years, defined by unprecedented institutional participation, major regulatory developments, and extreme price volatility.

Bitcoin: BTC correction deepens as Fed stance, US-Iran risks, mining disruptions weigh

Bitcoin (BTC) price extends correction, trading below $82,000 after sliding more than 5% so far this week. The bearish price action in BTC was fueled by fading institutional demand, as evidenced by spot Exchange-Traded Funds (ETFs), which recorded $978 million in inflows through Thursday.