ApeCoin price edges near a critical level, is the uptrend genuine?
- ApeCoin price shows compression of two Simple Moving Averages as price consolidates.
- APE price shows bullish re-entrance on the Volume Profile pattern, but traders should steer away from being early buyers.
- Invalidation of the bear trend remains at $6.15.

ApeCoin price edges near a bullish market trigger, but being an early bull could result in a catastrophic loss.
ApeCoin price is in a make-or-break predicament
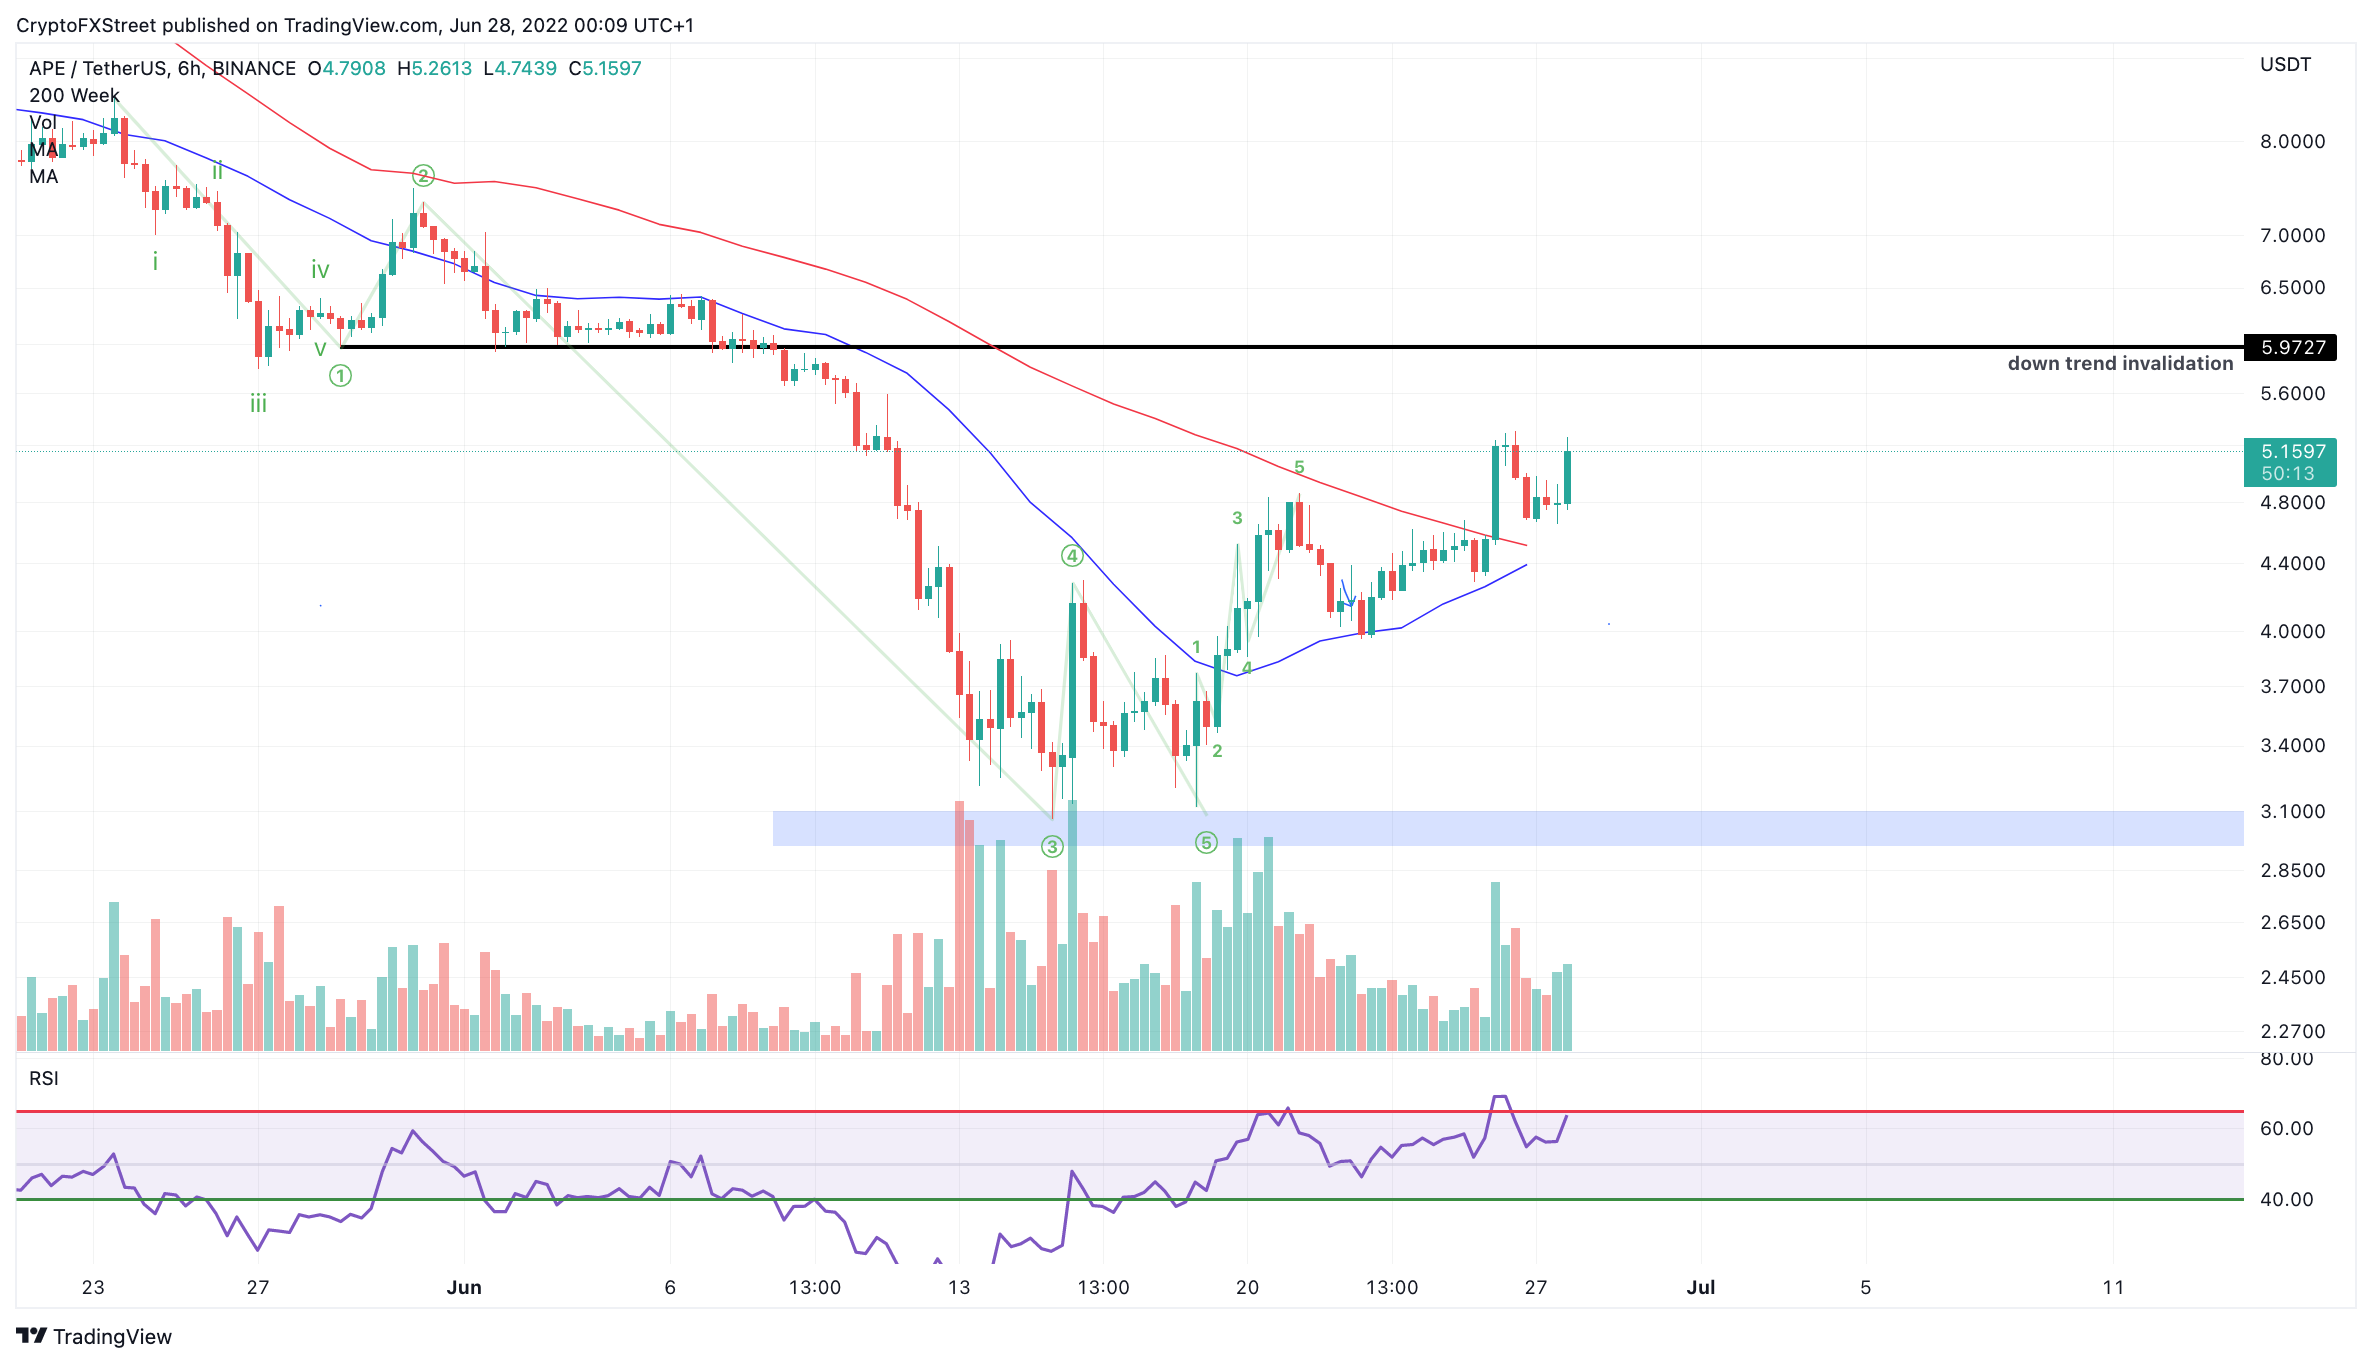
Apecoin is preparing to pierce through the $6.15 level, which has been mentioned in previous outlooks as a critical bearish invalidation level needed to confirm a bullish rally. On Monday, June 27, the bulls produced a bullish retest into the $5.15 zone since the first rejection was witnessed at the $5.00 barrier level over the weekend.
ApeCoin price signals bullish confluence as the 8- and 21-day Simple Moving Averages are currently compressing under the five-dollar trading range. This can be viewed as the initial bullish signs before a golden cross happens, which could induce a rally towards the $6.15 invalidation level and subsequently land in the $9.00 region.
APE/USDT 6-Hour Chart
However, traders should be cautious around this area as the technicals can also manifest into an opposite bearish scenario. If the 21-Day MA rolls over the 8-Day counterpart, the bears could fiercely strike again, sending the APE coin price as low as the $3.00 price level for a 40% loss. Thus being early buyers is not favorable from a risk-to-reward standpoint.
The safer play is to wait for a bullish confirmation through a breach of the $6.15 level. If the bulls conquer this level, there will be plenty of opportunities to join the uptrend upon a pullback and rally as high as $9.00, resulting in an 80% increase from the current ApeCoin price.
Author

Tony M.
FXStreet Contributor
Tony Montpeirous began investing in cryptocurrencies in 2017. His trading style incorporates Elliot Wave, Auction Market Theory, Fibonacci and price action as the cornerstone of his technical analysis.


